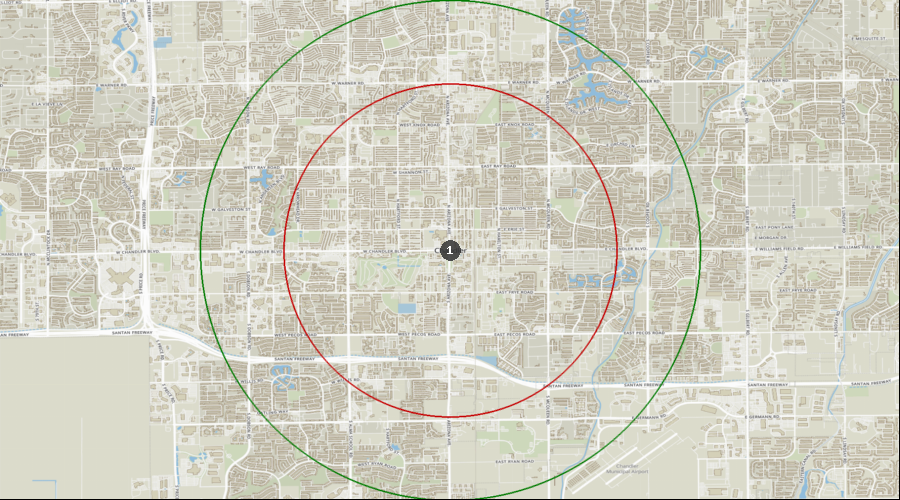
Chandler, Arizona - Dental Demographics Maps
Want comprehensive data on dentist to population ratios?
A Denali Demographic Study looks at the information in demographic reports like historical data, market saturation, growth drivers, and dental specific statistics, and interprets all these dental demographics to provide a viability ranking that other demographic reports typically don’t provide.
Get a custom study for as little as $159
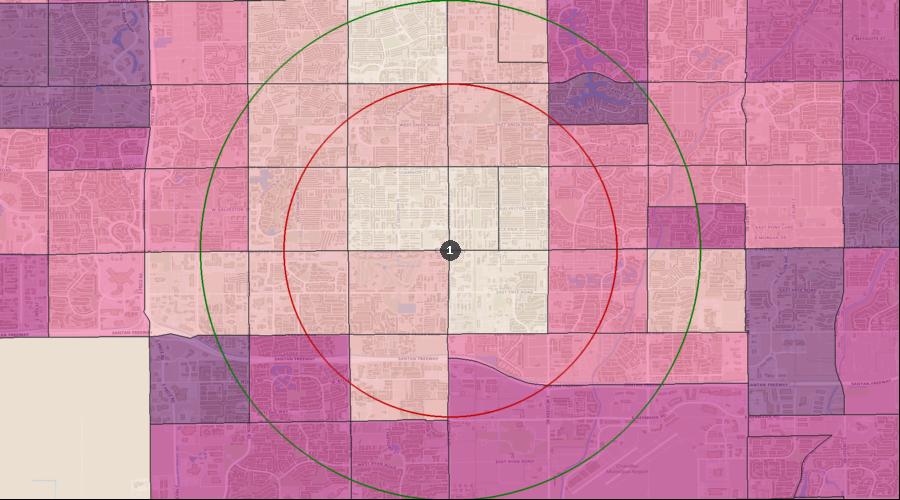
Average Dental Expenditures
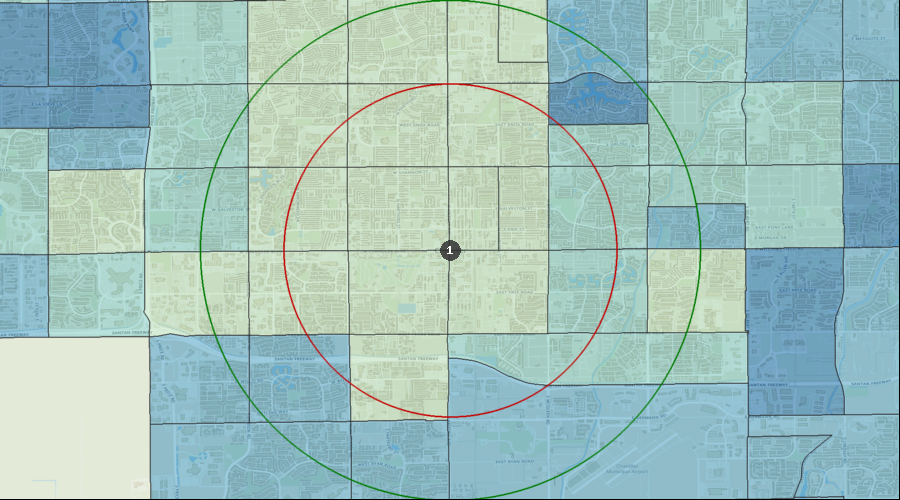
Dental Services per HH (Avg by Census Tract) | $614 to $873 |
| $508 to $614 |
| $396 to $508 |
| $190 to $396 |
| $123 to $190 |
| 1. | Chandler |
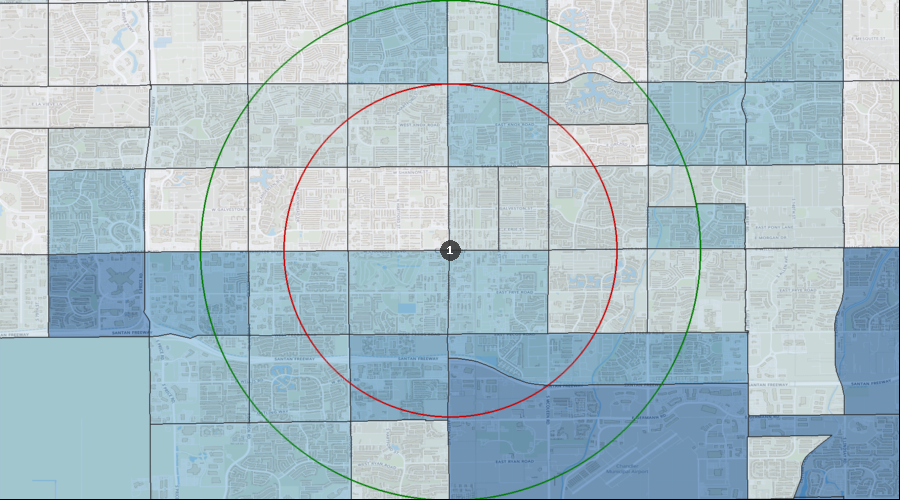
Percentage of the Population Visiting a Dentist in the Last 12 Months
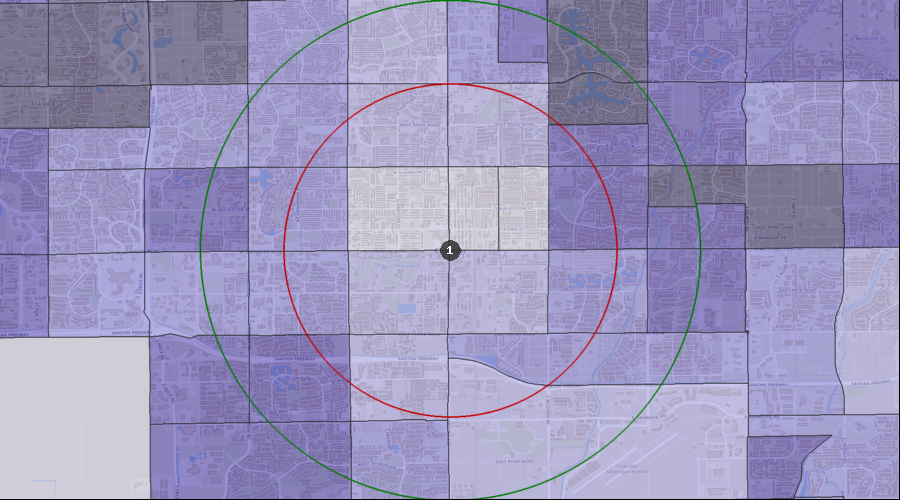
Visited a Dentist in Past 12 Months | 33.48% to 44.12% |
| 30.39% to 33.48% |
| 26.03% to 30.39% |
| 22.04% to 26.03% |
| 19.12% to 22.04% |
| 1. | Chandler |
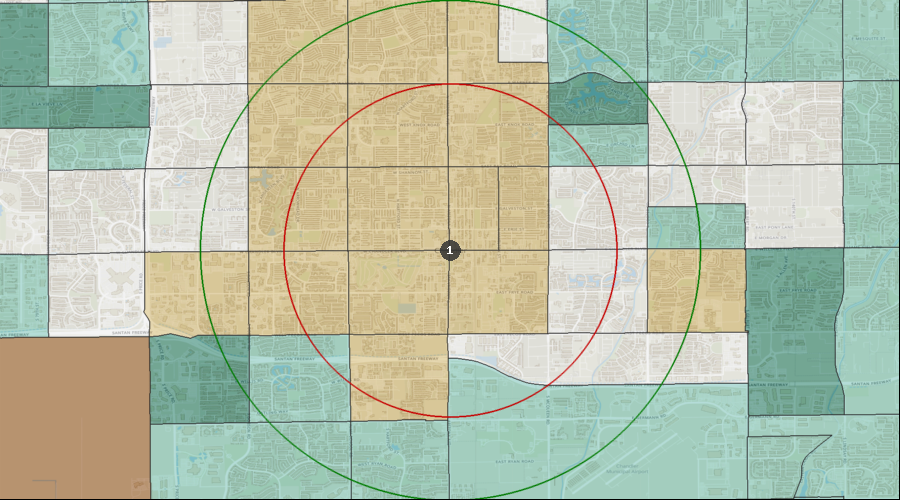
Percentage of the Population with a Bachelor's Degree
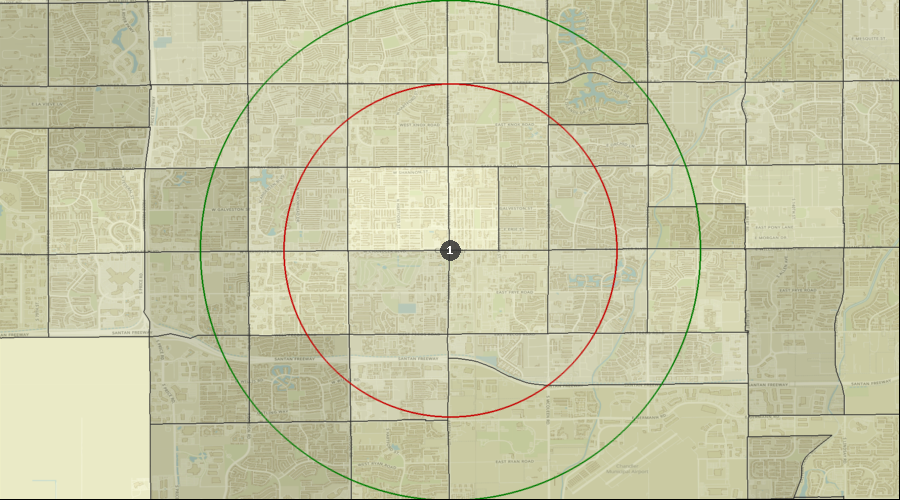
Education: Bach Deg by Census Tract | 54.98% to 69.58% |
| 43.82% to 54.98% |
| 33.37% to 43.82% |
| 18.87% to 33.37% |
| 0.00% to 18.87% |
| 1. | Chandler |
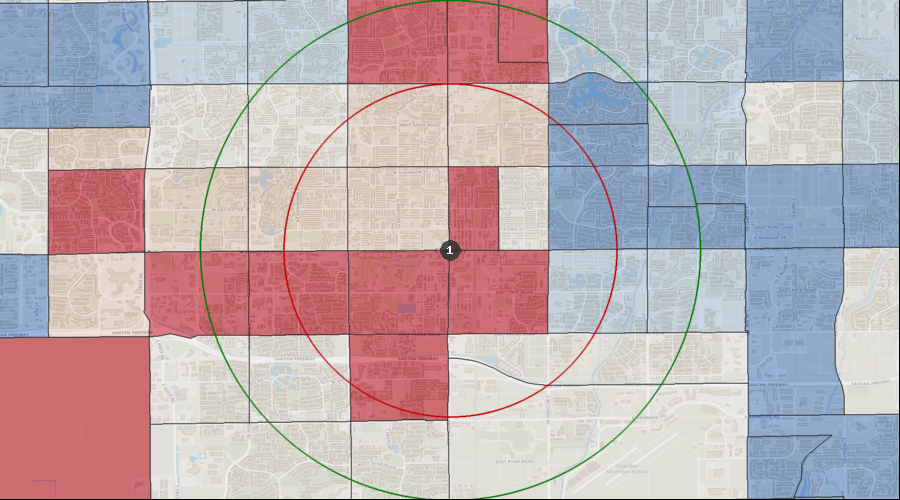
Lifestyle Behaviors – Household Entertainment/Recreation Average Expenditure
Ent/Recreation Per HH (Avg by Census Tract) | $4,989 to $7,220 |
| $4,192 to $4,989 |
| $3,234 to $4,192 |
| $2,494 to $3,234 |
| $1,194 to $2,494 |
| 1. | Chandler |
Projected Population Growth Rate
Projected Population Growth Per Year | 2.67% to 6.84% |
| 1.99% to 2.67% |
| 1.37% to 1.99% |
| 0.78% to 1.37% |
| 0.21% to 0.78% |
| 1. | Chandler |
Average Household Expenditure for Health Insurance
Health Insurance Avg/HH by Census Tract | $6,041 to $8,327 |
| $4,962 to $6,041 |
| $3,787 to $4,962 |
| $1,999 to $3,787 |
| $1,281 to $1,999 |
| 1. | Chandler |
Home Ownership Rates
Owner Occupied Households by Census Tract | 78.10% to 93.52% |
| 65.95% to 78.10% |
| 56.43% to 65.95% |
| 42.42% to 56.43% |
| 24.28% to 42.42% |
| 1. | Chandler |
Median Household Income
Median Household Income by Census Tract | $118k to $139k |
| $96k to $118k |
| $73k to $96k |
| $38k to $73k |
| $25k to $38k |
| 1. | Chandler |
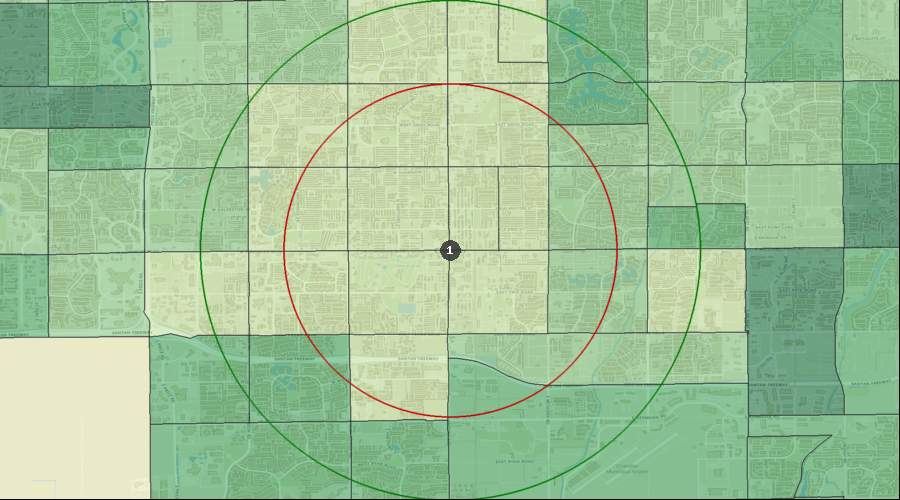
Daily Average Traffic Count
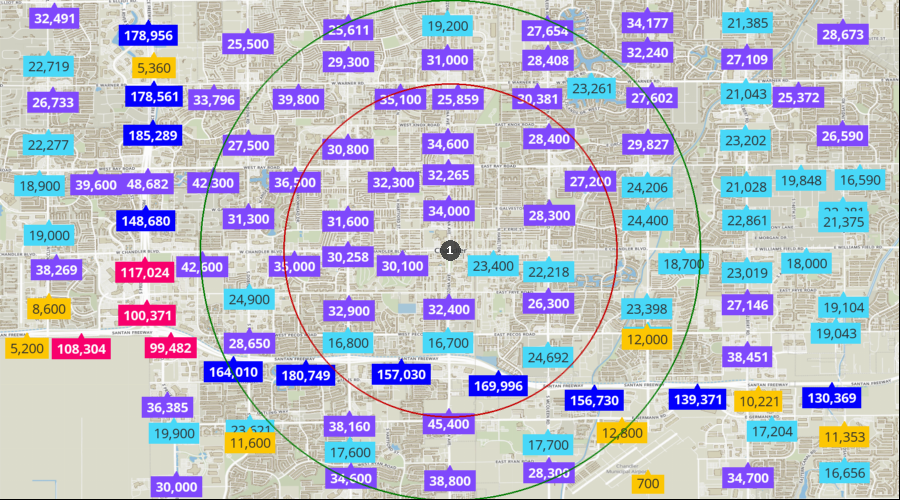
Traffic Counts | 130k to 185k |
| 54k to 130k |
| 25k to 54k |
| 13k to 25k |
| 0k to 13k |
| 1. | Chandler |