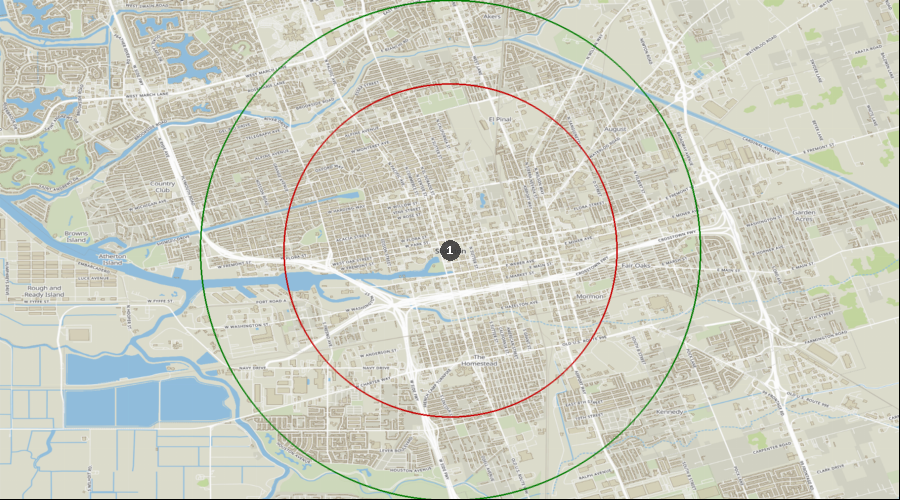
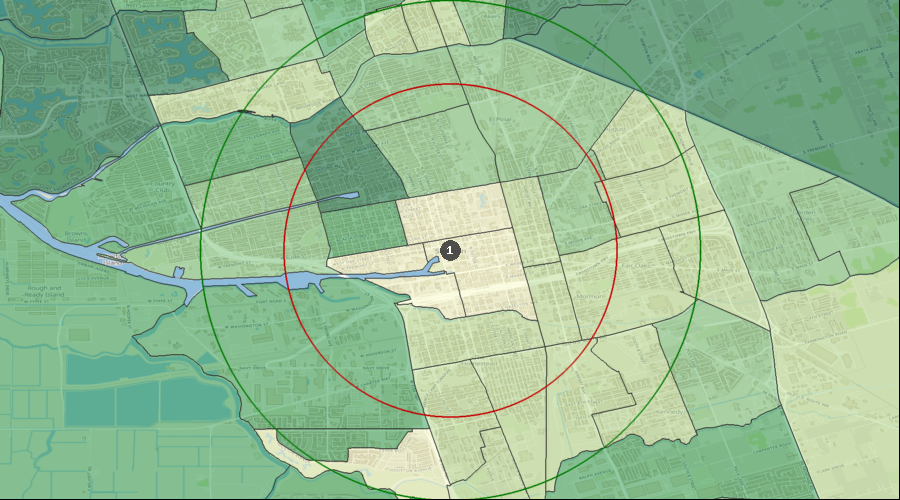
Stockton, California - Dental Demographics Maps
Want comprehensive data on dentist to population ratios?
A Denali Demographic Study looks at the information in demographic reports like historical data, market saturation, growth drivers, and dental specific statistics, and interprets all these dental demographics to provide a viability ranking that other demographic reports typically don’t provide.
Get a custom study for as little as $159
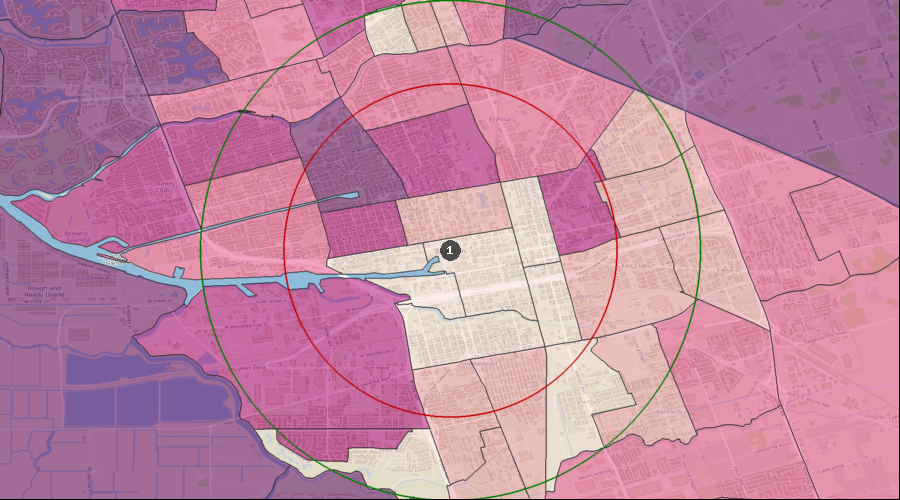
Average Dental Expenditures
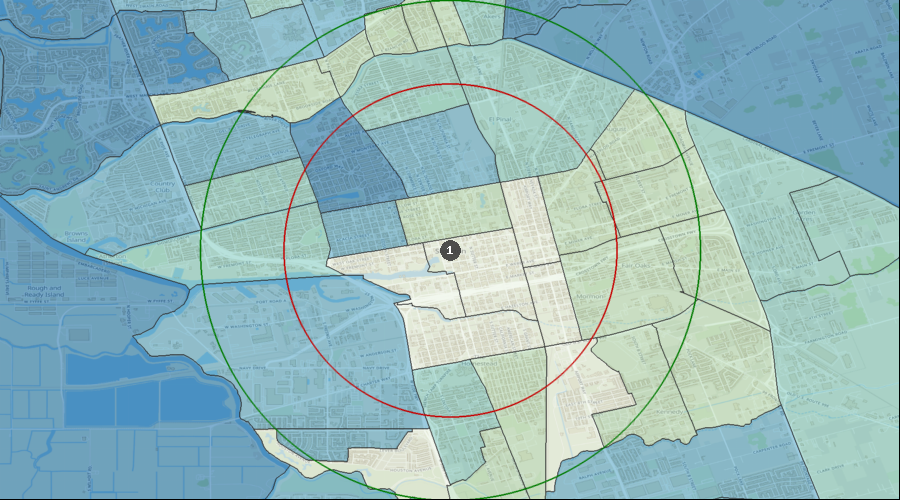
Dental Services per HH (Avg by Census Tract) | $366 to $734 |
| $283 to $366 |
| $222 to $283 |
| $179 to $222 |
| $108 to $179 |
| 1. | Stockton |
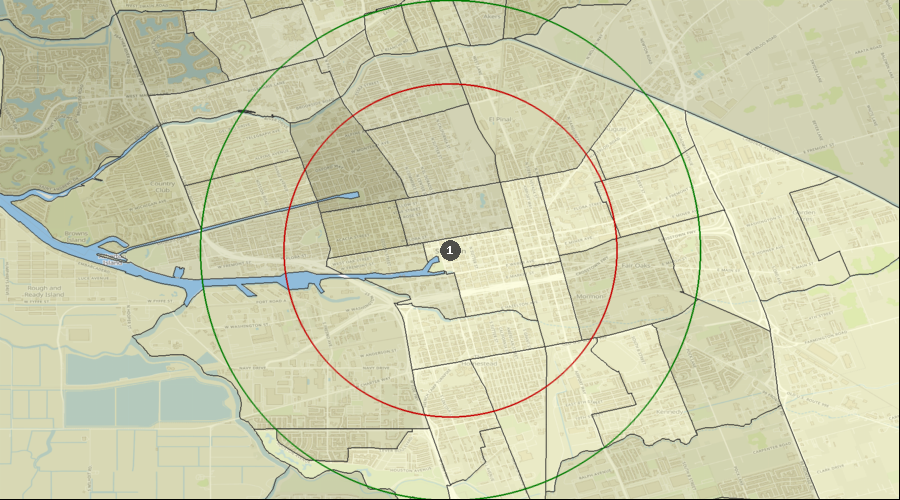
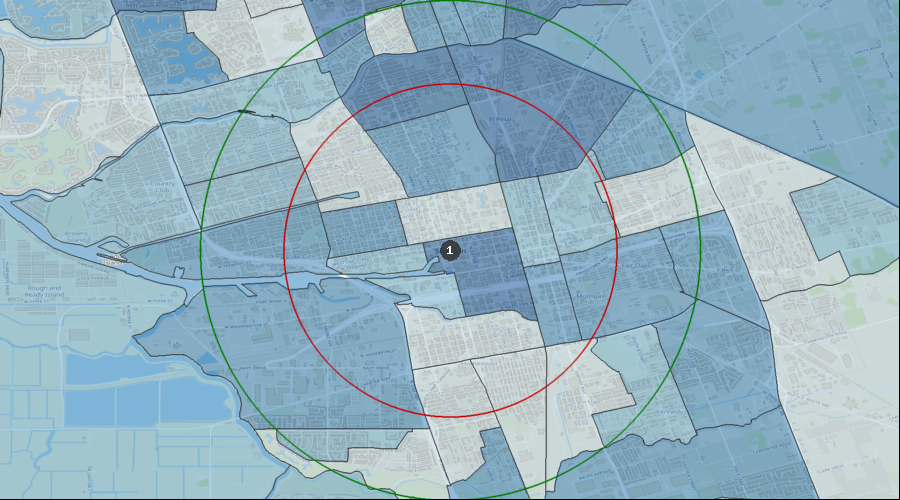
Percentage of the Population Visiting a Dentist in the Last 12 Months
Visited a Dentist in Past 12 Months | 28.93% to 41.35% |
| 24.88% to 28.93% |
| 21.81% to 24.88% |
| 19.32% to 21.81% |
| 15.65% to 19.32% |
| 1. | Stockton |
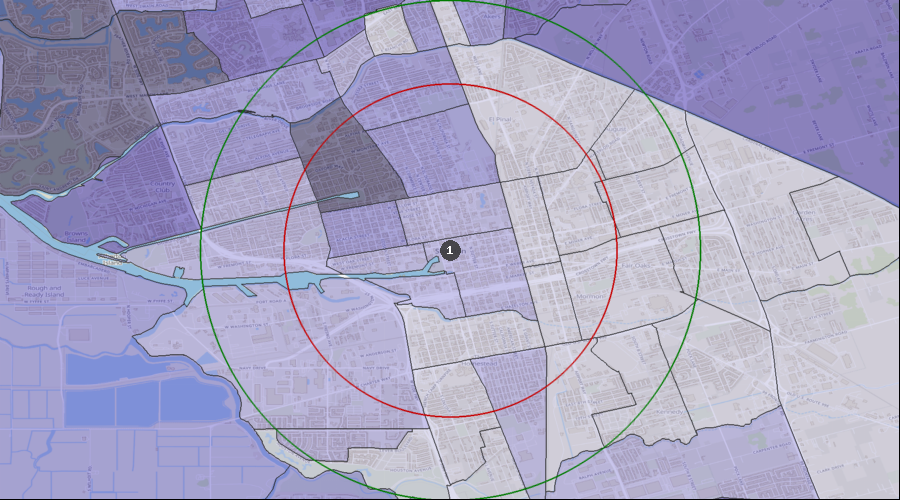
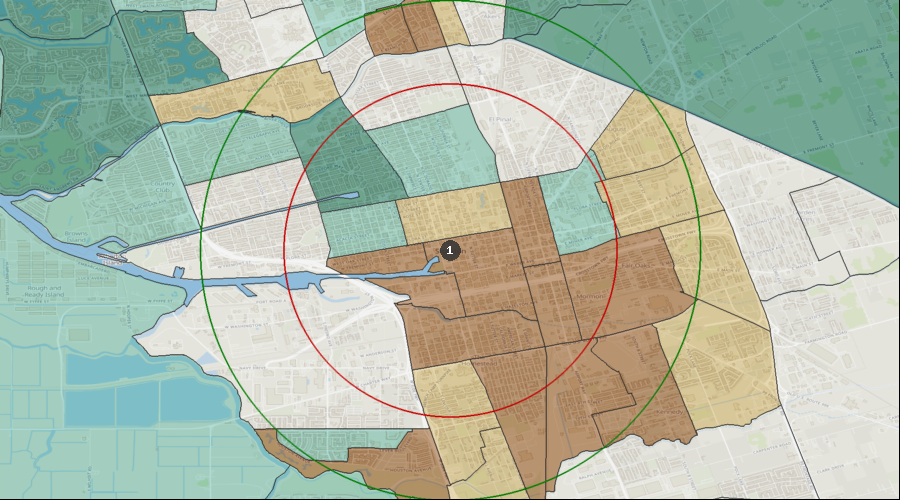
Percentage of the Population with a Bachelor's Degree
Education: Bach Deg by Census Tract | 30.48% to 55.62% |
| 22.19% to 30.48% |
| 13.73% to 22.19% |
| 6.19% to 13.73% |
| 0.53% to 6.19% |
| 1. | Stockton |
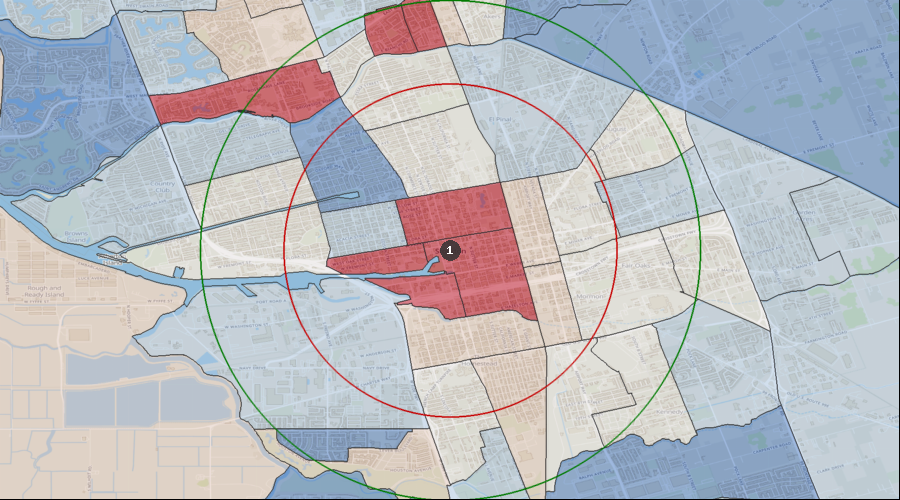
Lifestyle Behaviors – Household Entertainment/Recreation Average Expenditure
Ent/Recreation Per HH (Avg by Census Tract) | $2,982 to $6,268 |
| $2,358 to $2,982 |
| $1,878 to $2,358 |
| $1,479 to $1,878 |
| $891 to $1,479 |
| 1. | Stockton |
Projected Population Growth Rate
Projected Population Growth Per Year | 1.00% to 1.39% |
| 0.76% to 1.00% |
| 0.58% to 0.76% |
| 0.13% to 0.58% |
| 1. | Stockton |
Average Household Expenditure for Health Insurance
Health Insurance Avg/HH by Census Tract | $3,611 to $7,289 |
| $2,900 to $3,611 |
| $2,268 to $2,900 |
| $1,846 to $2,268 |
| $1,057 to $1,846 |
| 1. | Stockton |
Home Ownership Rates
Owner Occupied Households by Census Tract | 59.66% to 75.18% |
| 48.16% to 59.66% |
| 33.18% to 48.16% |
| 17.60% to 33.18% |
| 2.68% to 17.60% |
| 1. | Stockton |
Median Household Income
Median Household Income by Census Tract | $62k to $134k |
| $49k to $62k |
| $38k to $49k |
| $26k to $38k |
| $15k to $26k |
| 1. | Stockton |
Daily Average Traffic Count
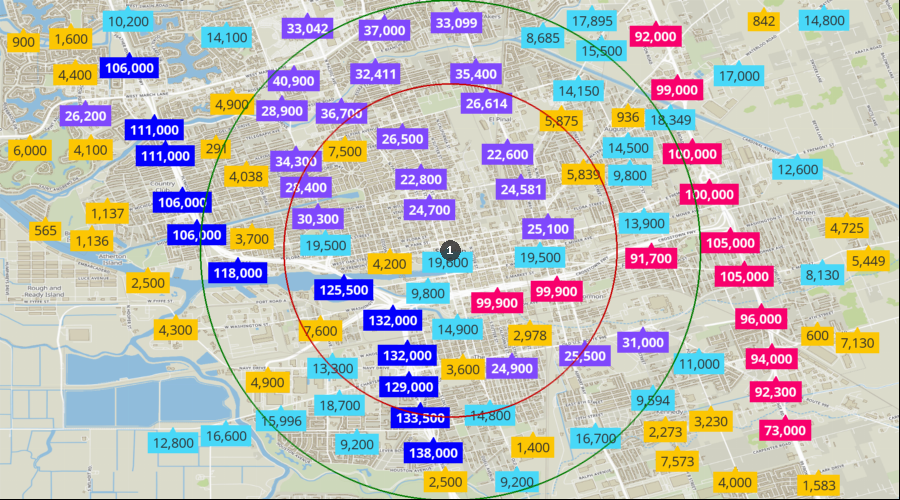
Traffic Counts | 106k to 138k |
| 41k to 106k |
| 21k to 41k |
| 8k to 21k |
| 0k to 8k |
| 1. | Stockton |