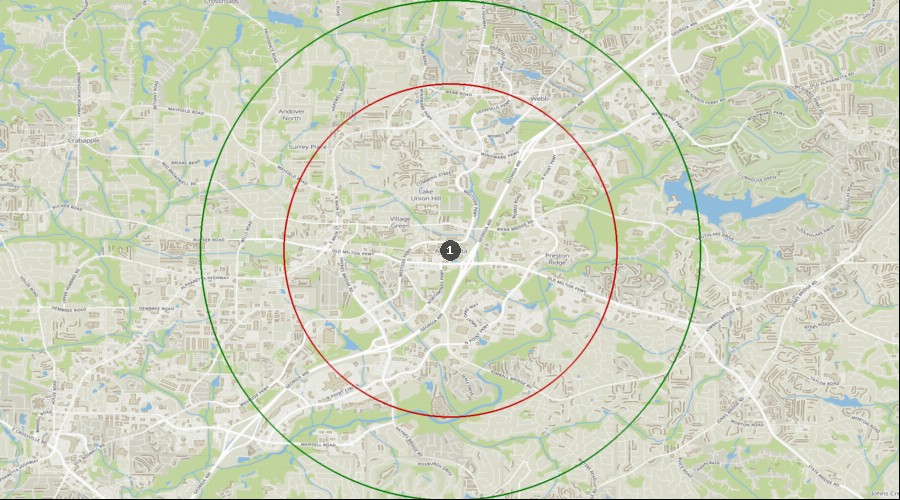
Alpharetta, Georgia - Dental Demographics Maps
Want comprehensive data on dentist to population ratios?
A Denali Demographic Study looks at the information in demographic reports like historical data, market saturation, growth drivers, and dental specific statistics, and interprets all these dental demographics to provide a viability ranking that other demographic reports typically don’t provide.
Get a custom study for as little as $159
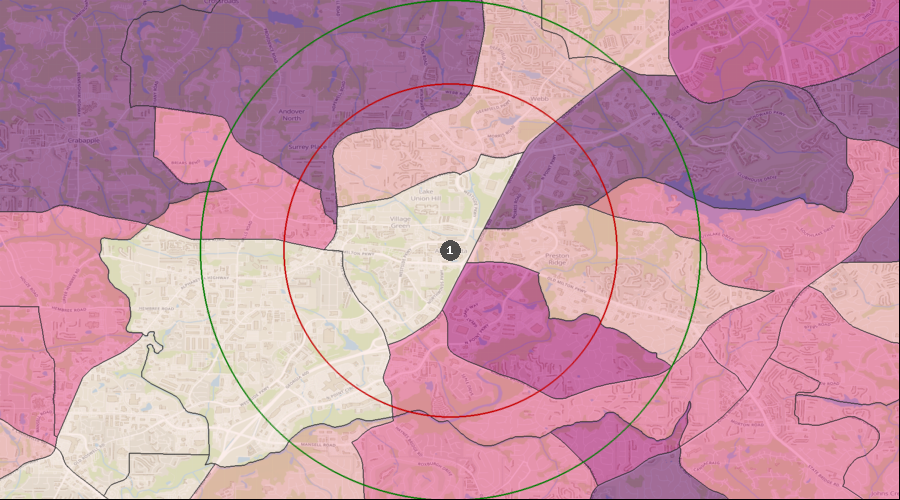
Average Dental Expenditures
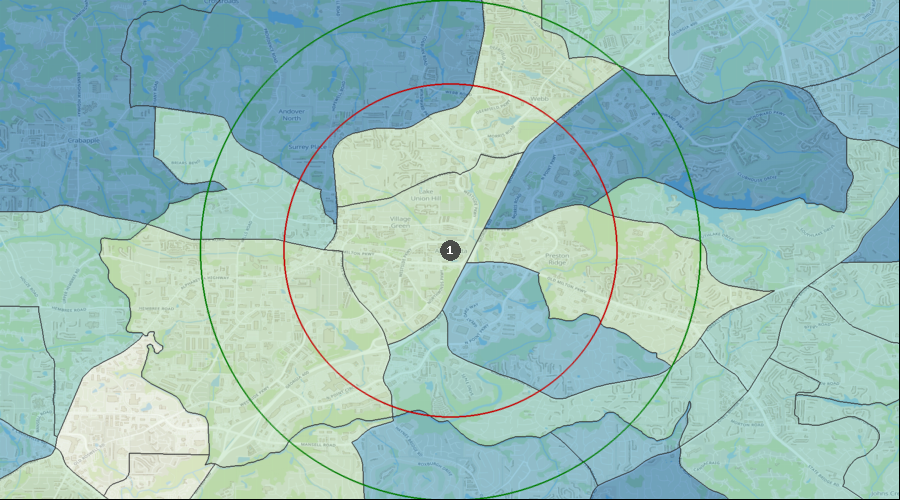
Dental Services per HH (Avg by Census Tract) | $766 to $1,026 |
| $681 to $766 |
| $529 to $681 |
| $298 to $529 |
| $223 to $298 |
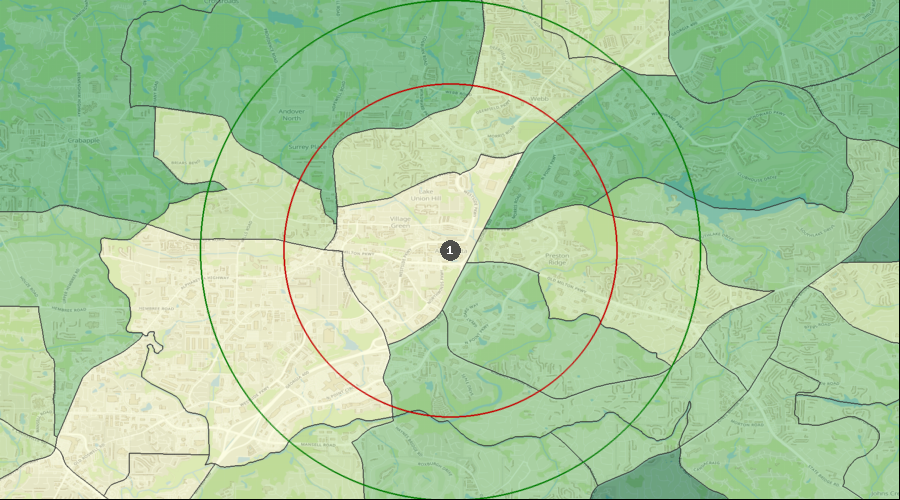
| 1. | Alpharetta |
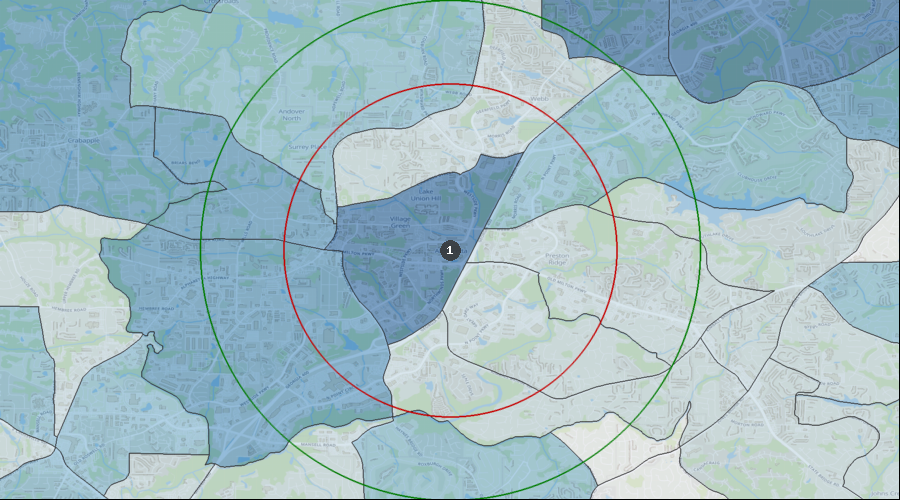
Percentage of the Population Visiting a Dentist in the Last 12 Months
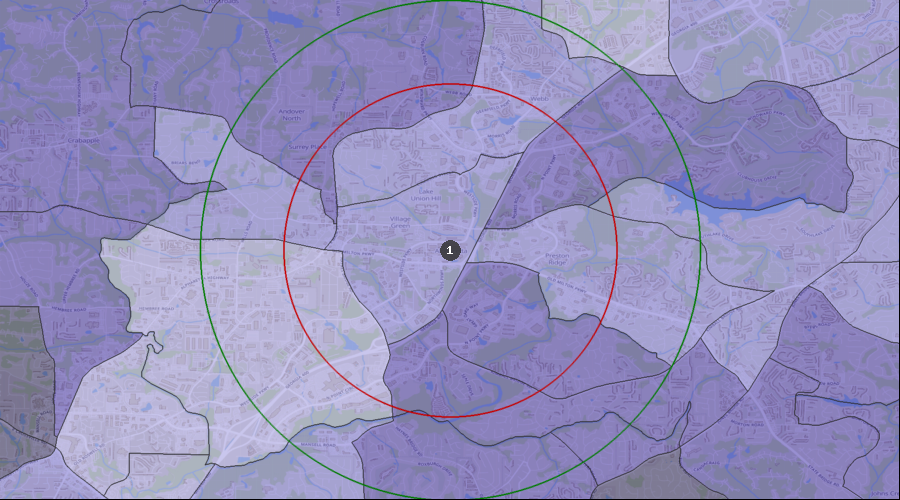
Visited a Dentist in Past 12 Months | 35.36% to 38.18% |
| 31.83% to 35.36% |
| 26.31% to 31.83% |
| 17.88% to 26.31% |
| 1. | Alpharetta |
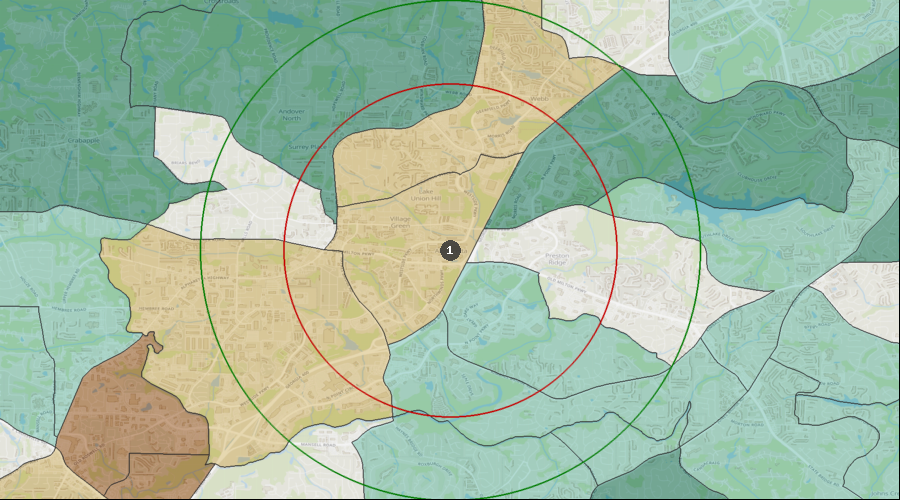
Percentage of the Population with a Bachelor's Degree
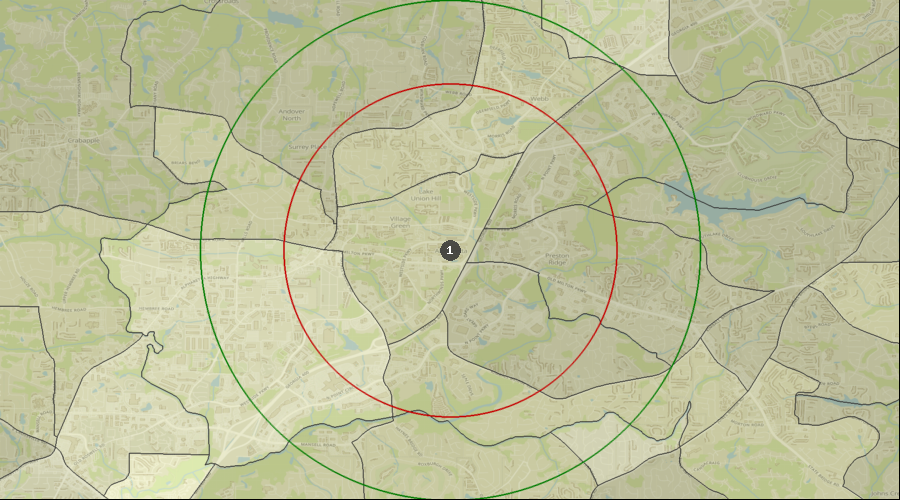
Education: Bach Deg by Census Tract | 65.65% to 76.91% |
| 53.53% to 65.65% |
| 45.49% to 53.53% |
| 17.65% to 45.49% |
| 1. | Alpharetta |
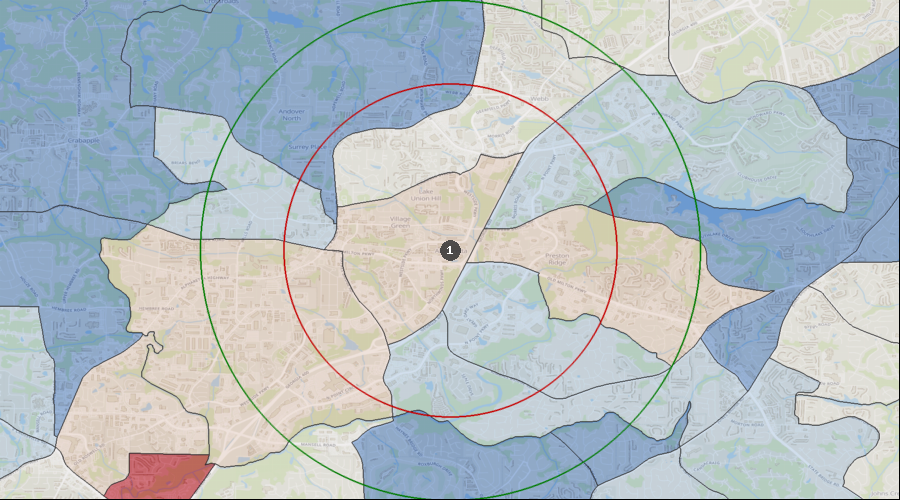
Lifestyle Behaviors – Household Entertainment/Recreation Average Expenditure
Ent/Recreation Per HH (Avg by Census Tract) | $6,435 to $8,834 |
| $5,611 to $6,435 |
| $4,736 to $5,611 |
| $3,485 to $4,736 |
| $1,909 to $3,485 |
| 1. | Alpharetta |
Projected Population Growth Rate
Projected Population Growth Per Year | 2.41% to 5.11% |
| 1.64% to 2.41% |
| 1.12% to 1.64% |
| 0.59% to 1.12% |
| 0.12% to 0.59% |
| 1. | Alpharetta |
Average Household Expenditure for Health Insurance
Health Insurance Avg/HH by Census Tract | $7,212 to $10,082 |
| $5,560 to $7,212 |
| $4,004 to $5,560 |
| $2,931 to $4,004 |
| $2,137 to $2,931 |
| 1. | Alpharetta |
Home Ownership Rates
Owner Occupied Households by Census Tract | 80.20% to 94.69% |
| 66.64% to 80.20% |
| 41.11% to 66.64% |
| 22.83% to 41.11% |
| 14.30% to 22.83% |
| 1. | Alpharetta |
Median Household Income
Median Household Income by Census Tract | $160k to $200k |
| $132k to $160k |
| $105k to $132k |
| $67k to $105k |
| $39k to $67k |
| 1. | Alpharetta |
Daily Average Traffic Count
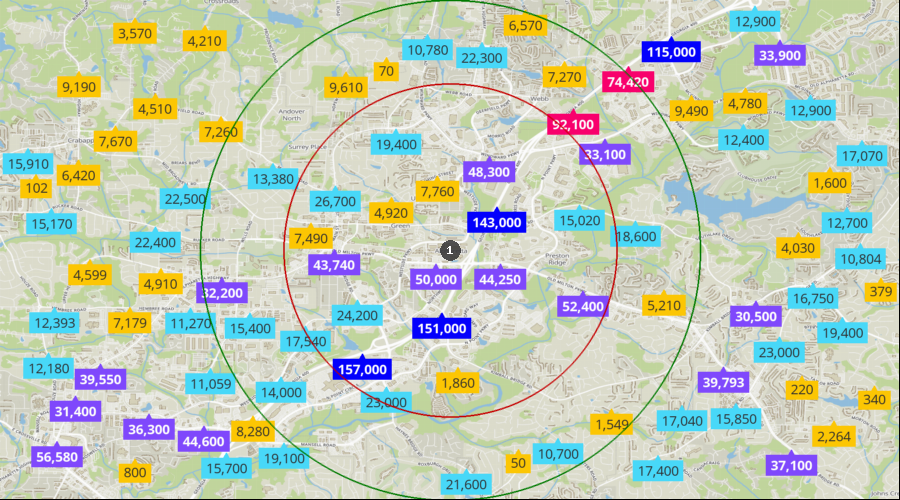
Traffic Counts | 115k to 175k |
| 58k to 115k |
| 28k to 58k |
| 10k to 28k |
| 0k to 10k |
| 1. | Alpharetta |