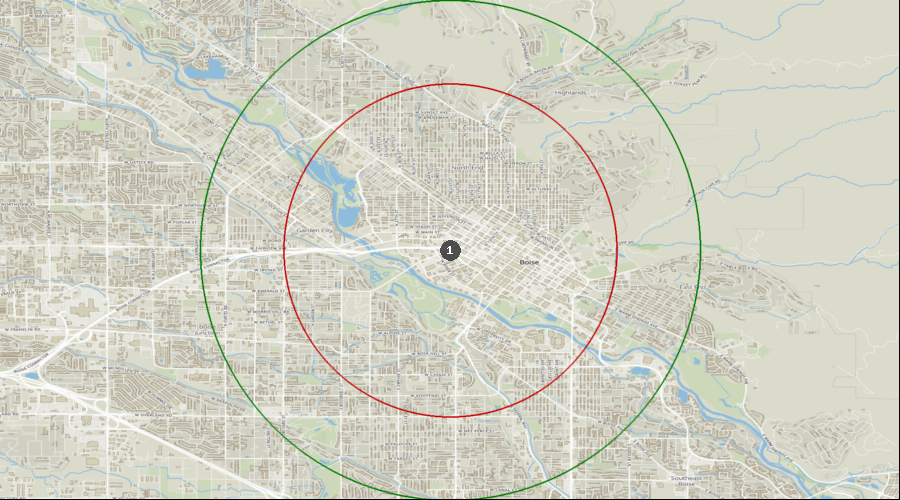
Boise City, Idaho - Dental Demographics Maps
Want comprehensive data on dentist to population ratios?
A Denali Demographic Study looks at the information in demographic reports like historical data, market saturation, growth drivers, and dental specific statistics, and interprets all these dental demographics to provide a viability ranking that other demographic reports typically don’t provide.
Get a custom study for as little as $159
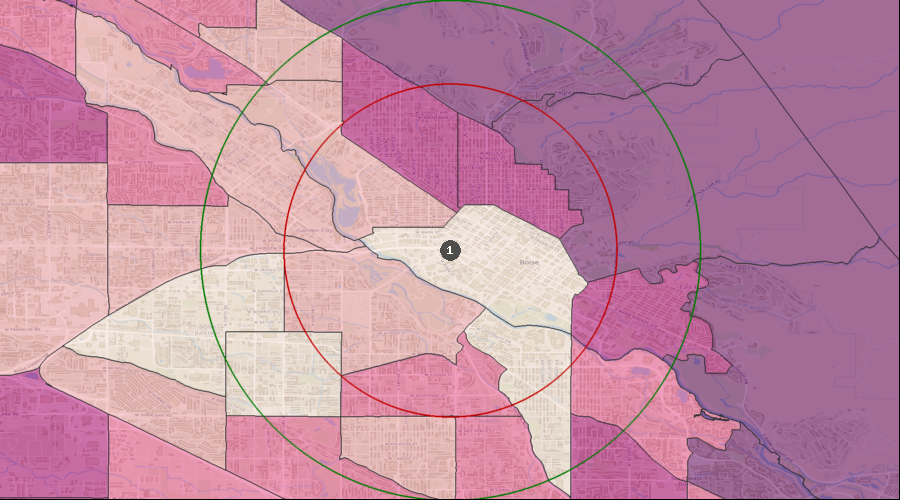
Average Dental Expenditures
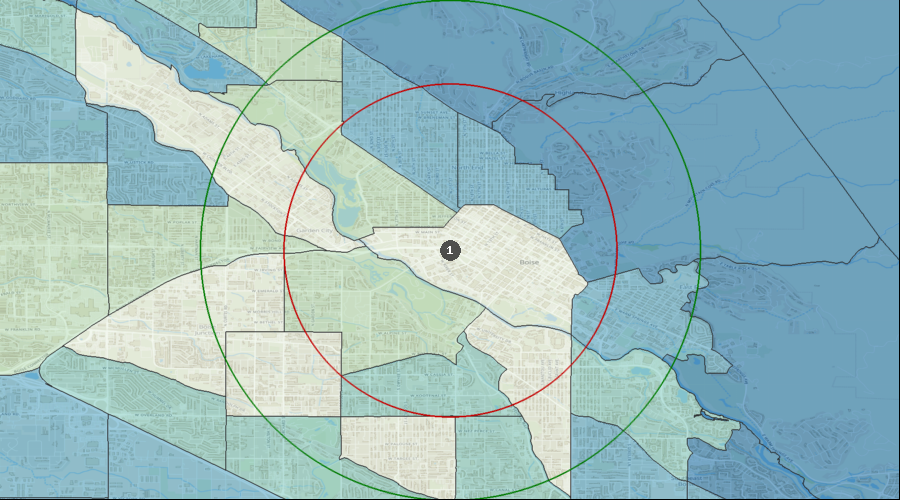
Dental Services per HH (Avg by Census Tract) | $481 to $752 |
| $423 to $481 |
| $367 to $423 |
| $267 to $367 |
| $179 to $267 |
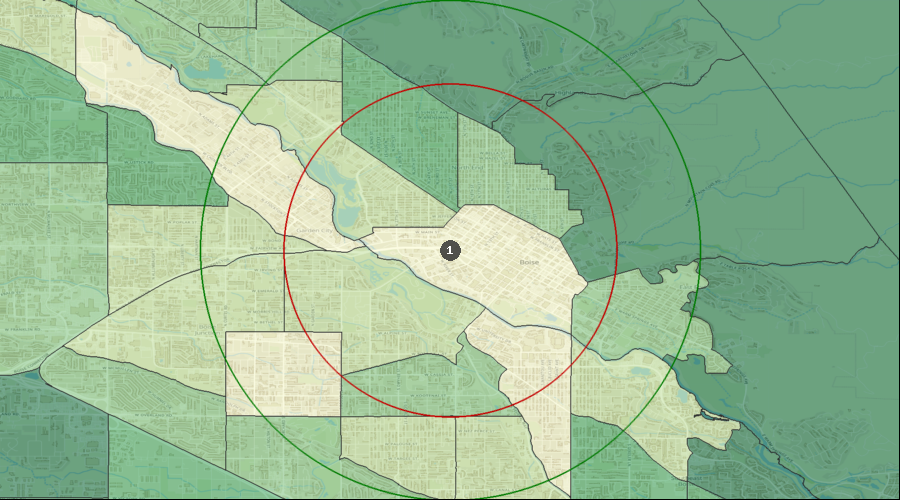
| 1. | Boise City |
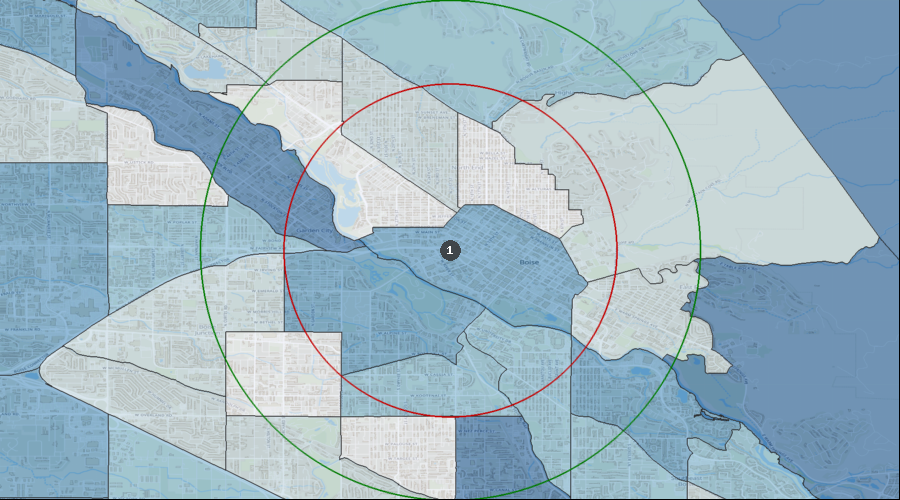
Percentage of the Population Visiting a Dentist in the Last 12 Months
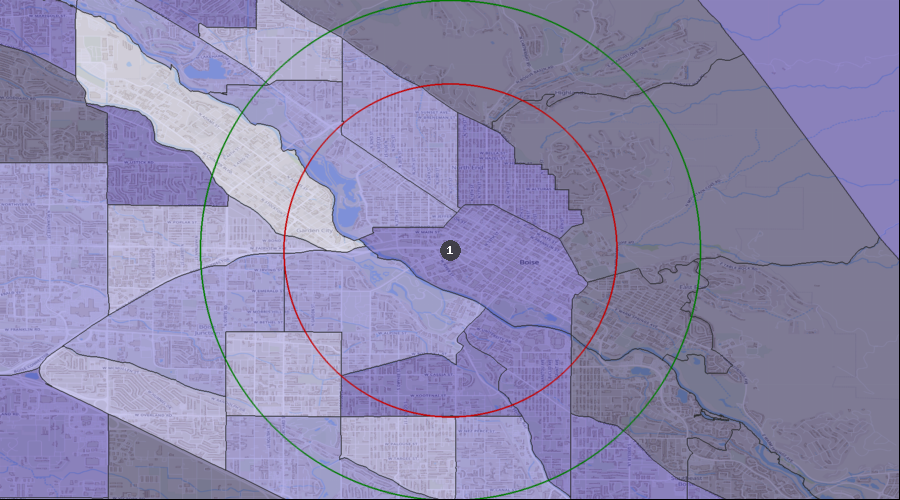
Visited a Dentist in Past 12 Months | 34.38% to 40.10% |
| 30.15% to 34.38% |
| 27.05% to 30.15% |
| 19.88% to 27.05% |
| 1. | Boise City |
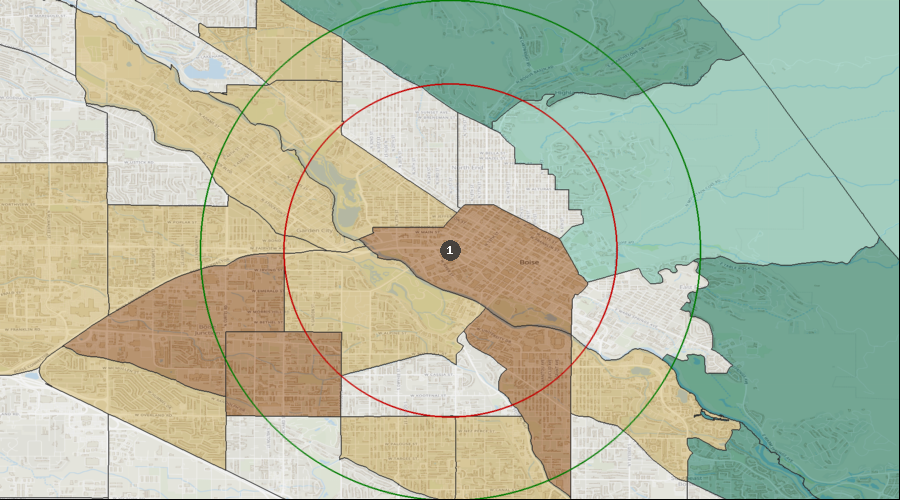
Percentage of the Population with a Bachelor's Degree
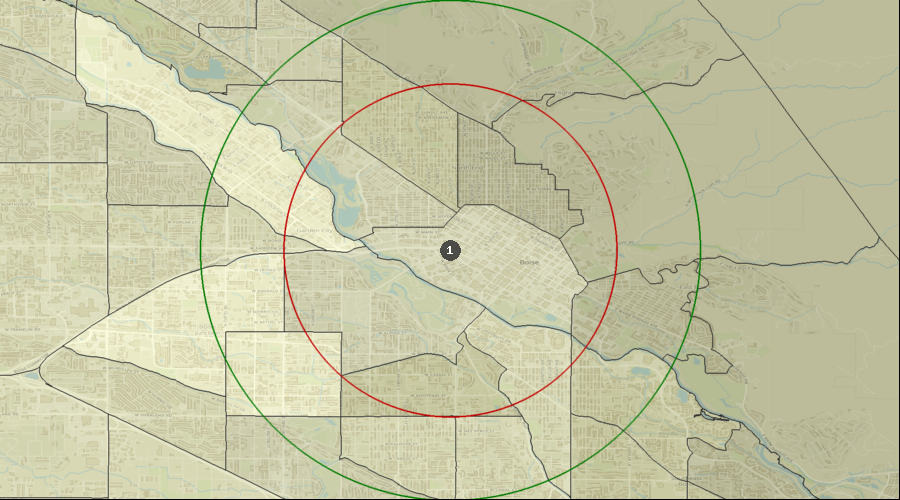
Education: Bach Deg by Census Tract | 55.83% to 72.99% |
| 47.11% to 55.83% |
| 36.50% to 47.11% |
| 10.01% to 36.50% |
| 1. | Boise City |
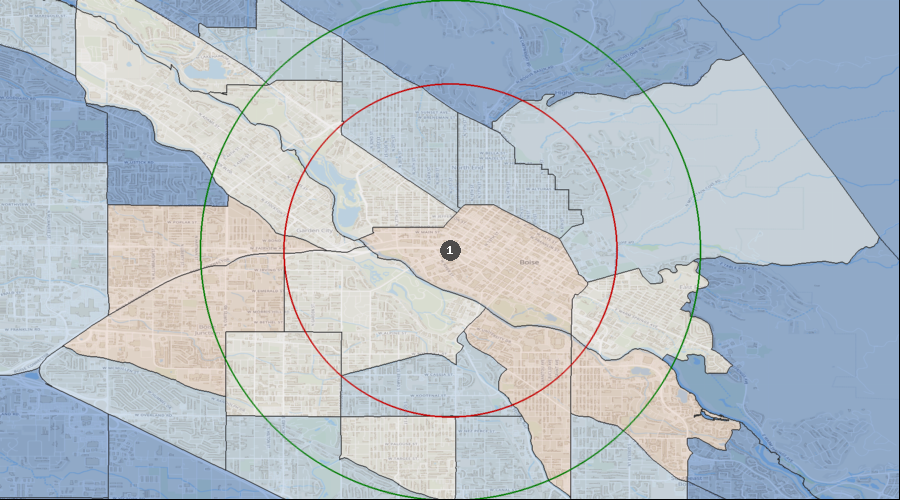
Lifestyle Behaviors – Household Entertainment/Recreation Average Expenditure
Ent/Recreation Per HH (Avg by Census Tract) | $3,933 to $5,916 |
| $3,302 to $3,933 |
| $2,776 to $3,302 |
| $2,146 to $2,776 |
| $1,598 to $2,146 |
| 1. | Boise City |
Projected Population Growth Rate
Projected Population Growth Per Year | 1.98% to 5.47% |
| 1.67% to 1.98% |
| 1.37% to 1.67% |
| 0.95% to 1.37% |
| 0.77% to 0.95% |
| 1. | Boise City |
Average Household Expenditure for Health Insurance
Health Insurance Avg/HH by Census Tract | $4,874 to $7,429 |
| $4,390 to $4,874 |
| $3,735 to $4,390 |
| $2,738 to $3,735 |
| $1,909 to $2,738 |
| 1. | Boise City |
Home Ownership Rates
Owner Occupied Households by Census Tract | 70.32% to 92.90% |
| 59.77% to 70.32% |
| 47.87% to 59.77% |
| 32.44% to 47.87% |
| 16.51% to 32.44% |
| 1. | Boise City |
Median Household Income
Median Household Income by Census Tract | $83k to $141k |
| $71k to $83k |
| $59k to $71k |
| $40k to $59k |
| $27k to $40k |
| 1. | Boise City |
Daily Average Traffic Count
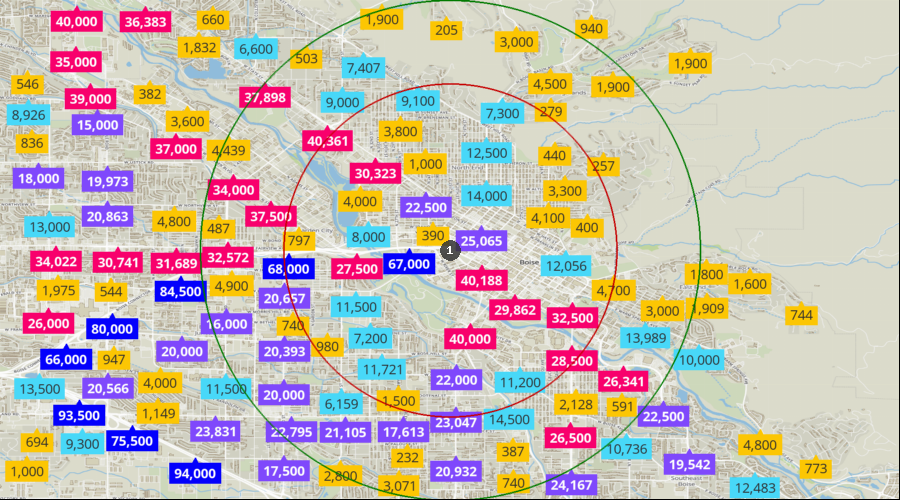
Traffic Counts | 49k to 94k |
| 26k to 49k |
| 15k to 26k |
| 5k to 15k |
| 0k to 5k |
| 1. | Boise City |