Newburgh, New York - Dental Demographics Maps
Want comprehensive data on dentist to population ratios?
A Denali Demographic Study looks at the information in demographic reports like historical data, market saturation, growth drivers, and dental specific statistics, and interprets all these dental demographics to provide a viability ranking that other demographic reports typically don’t provide.
Get a custom study for as little as $159
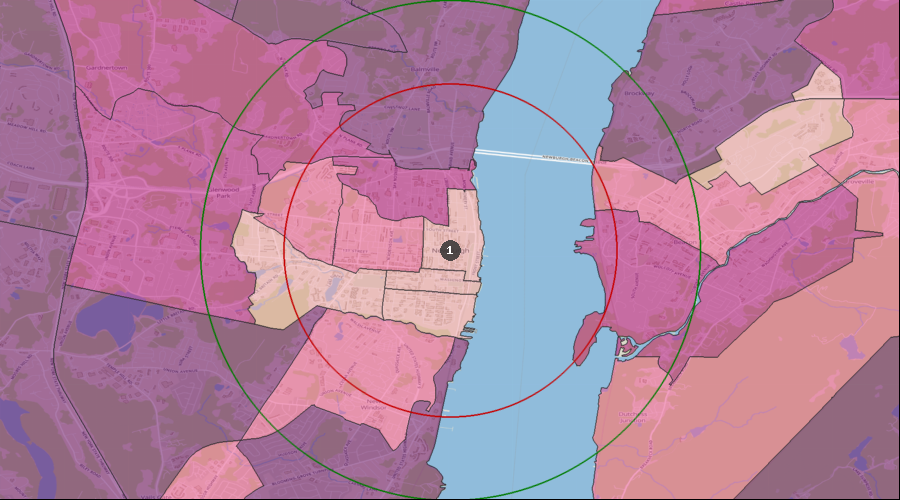
Average Dental Expenditures
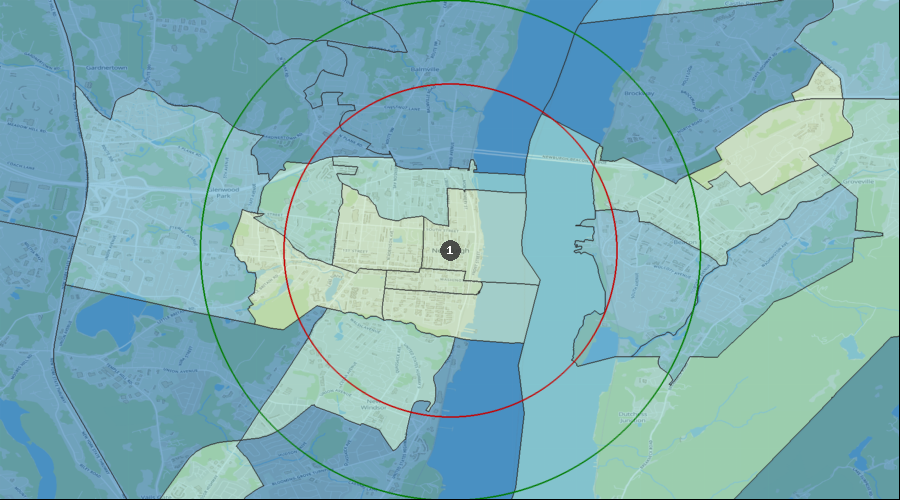
Dental Services per HH (Avg by Census Tract) | $441 to $800 |
| $366 to $441 |
| $253 to $366 |
| $0 to $253 |
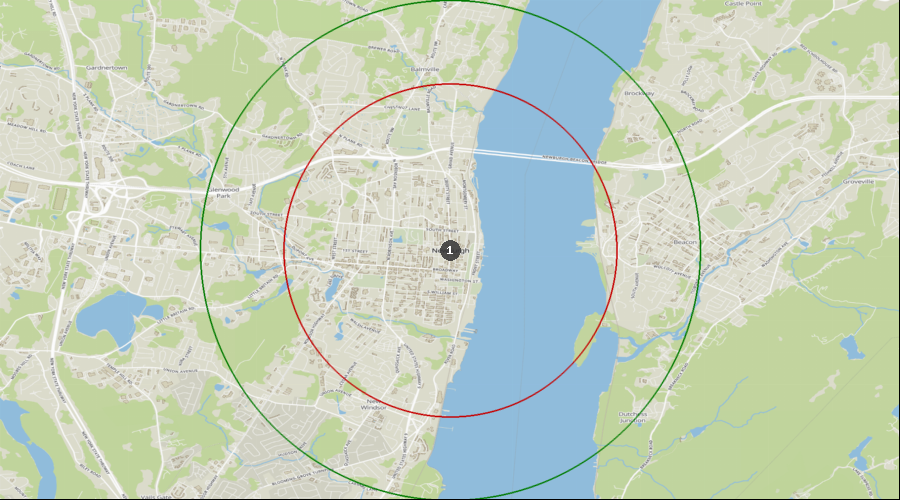
| 1. | Newburgh |
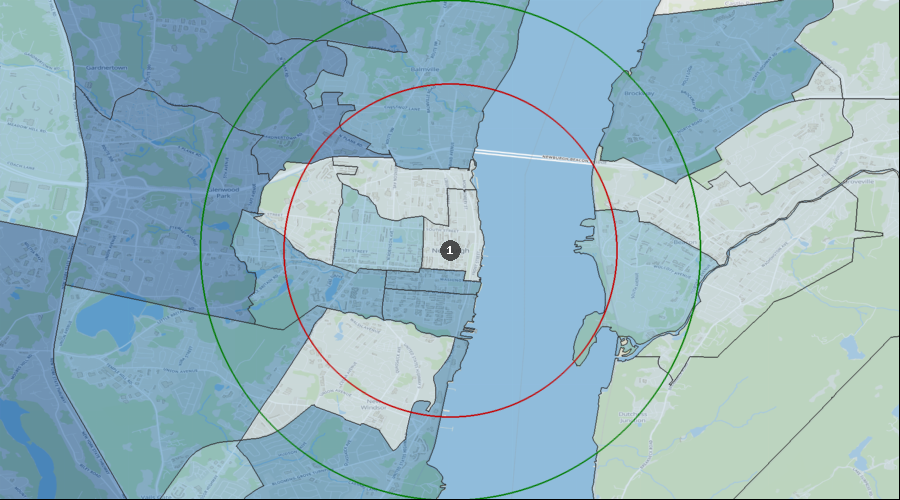
Percentage of the Population Visiting a Dentist in the Last 12 Months
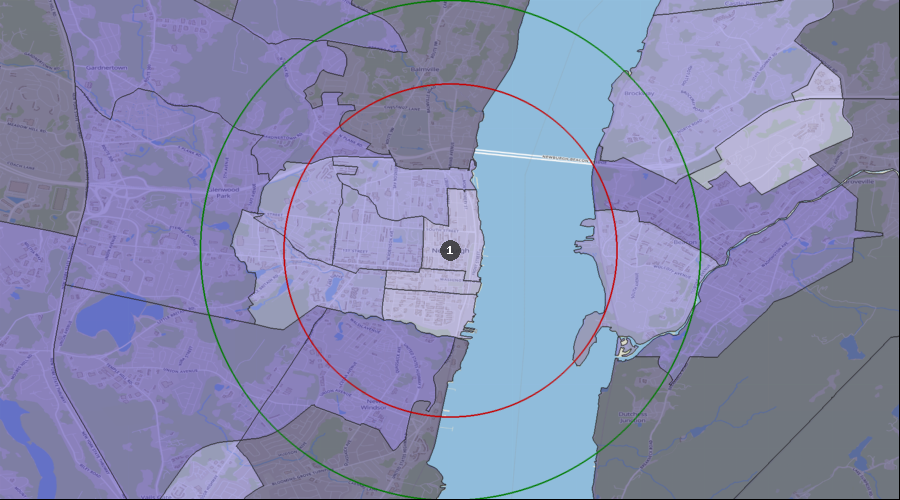
Visited a Dentist in Past 12 Months | 34.44% to 39.75% |
| 30.34% to 34.44% |
| 20.67% to 30.34% |
| 0.00% to 20.67% |
| 1. | Newburgh |
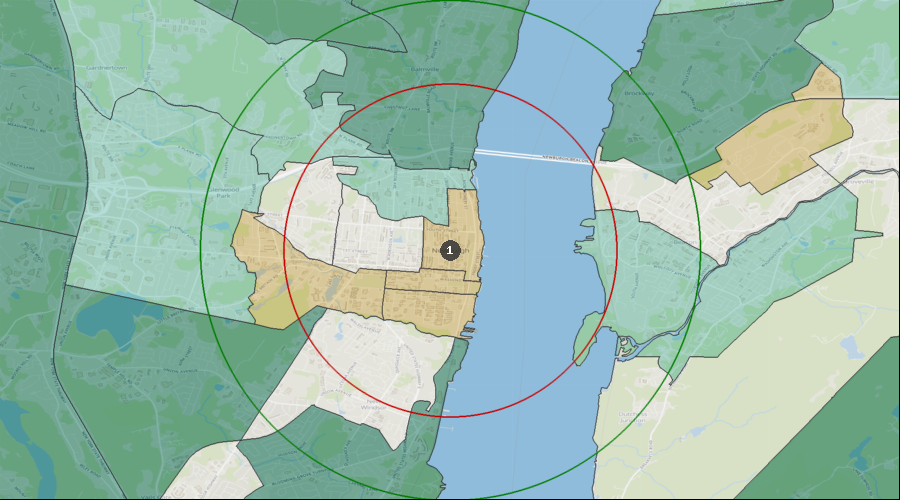
Percentage of the Population with a Bachelor's Degree
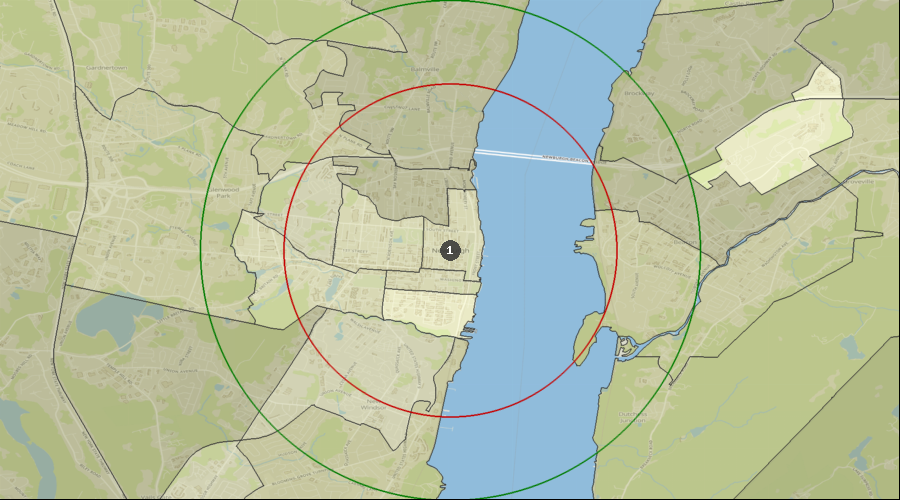
Education: Bach Deg by Census Tract | 34.40% to 55.89% |
| 23.48% to 34.40% |
| 13.71% to 23.48% |
| 6.03% to 13.71% |
| 4.69% to 6.03% |
| 1. | Newburgh |
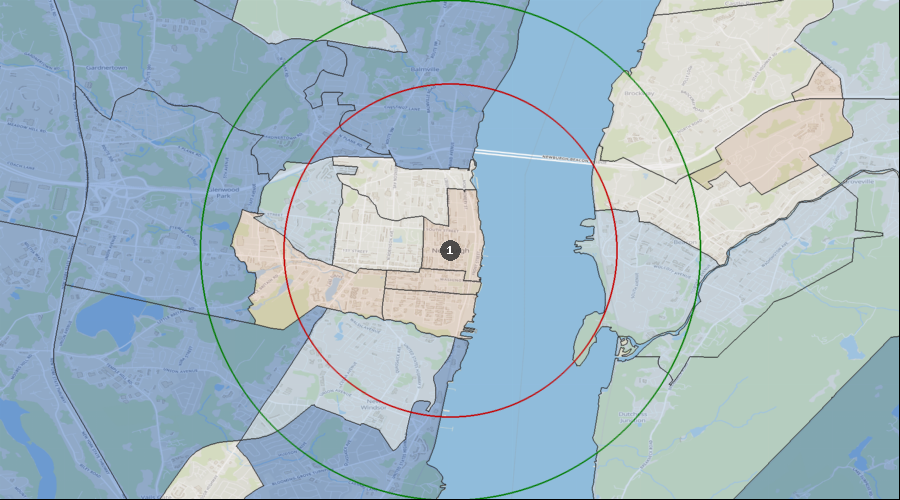
Lifestyle Behaviors – Household Entertainment/Recreation Average Expenditure
Ent/Recreation Per HH (Avg by Census Tract) | $3,527 to $6,298 |
| $2,904 to $3,527 |
| $2,288 to $2,904 |
| $0 to $2,288 |
| 1. | Newburgh |
Projected Population Growth Rate
Projected Population Growth Per Year | 0.86% to 2.48% |
| 0.39% to 0.86% |
| 0.14% to 0.39% |
| -0.31% to 0.14% |
| -0.42% to -0.31% |
| 1. | Newburgh |
Average Household Expenditure for Health Insurance
Health Insurance Avg/HH by Census Tract | $4,191 to $7,399 |
| $3,451 to $4,191 |
| $2,625 to $3,451 |
| $0 to $2,625 |
| 1. | Newburgh |
Home Ownership Rates
Owner Occupied Households by Census Tract | 70.33% to 84.93% |
| 46.22% to 70.33% |
| 24.00% to 46.22% |
| 0.00% to 24.00% |
| 1. | Newburgh |
Median Household Income
Median Household Income by Census Tract | $84k to $119k |
| $67k to $84k |
| $47k to $67k |
| $0k to $47k |
| 1. | Newburgh |
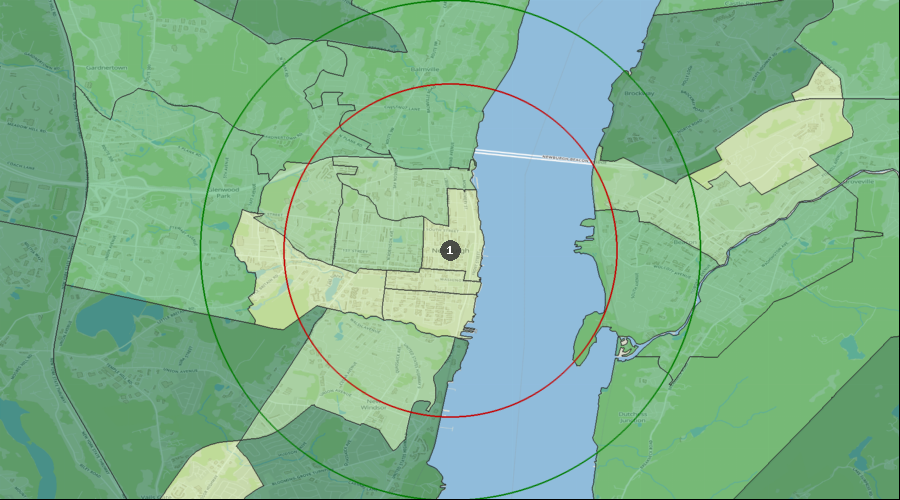
Daily Average Traffic Count
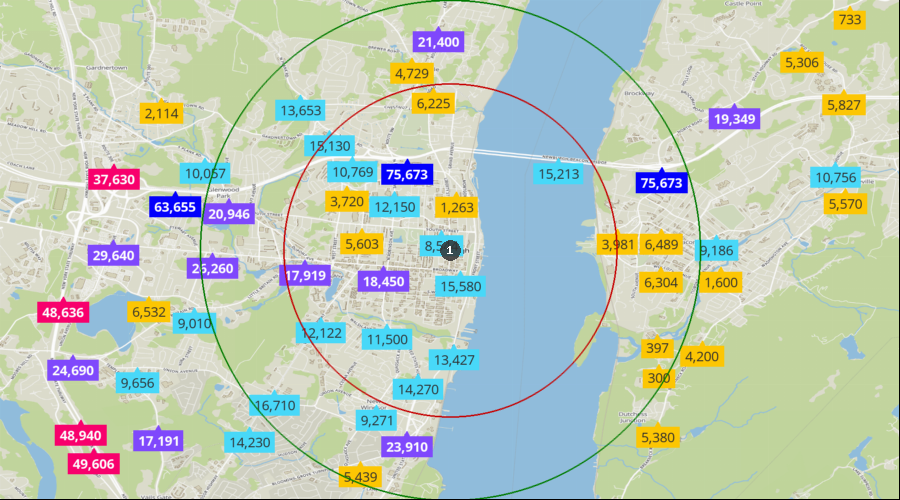
Traffic Counts | 52k to 76k |
| 32k to 52k |
| 17k to 32k |
| 8k to 17k |
| 0k to 8k |
| 1. | Newburgh |