Cary, North Carolina - Dental Demographics Maps
Want comprehensive data on dentist to population ratios?
A Denali Demographic Study looks at the information in demographic reports like historical data, market saturation, growth drivers, and dental specific statistics, and interprets all these dental demographics to provide a viability ranking that other demographic reports typically don’t provide.
Get a custom study for as little as $159
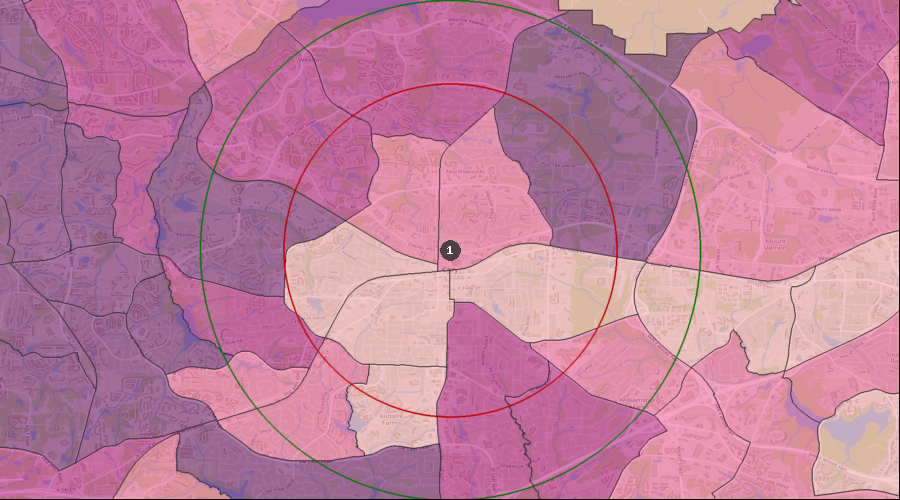
Average Dental Expenditures
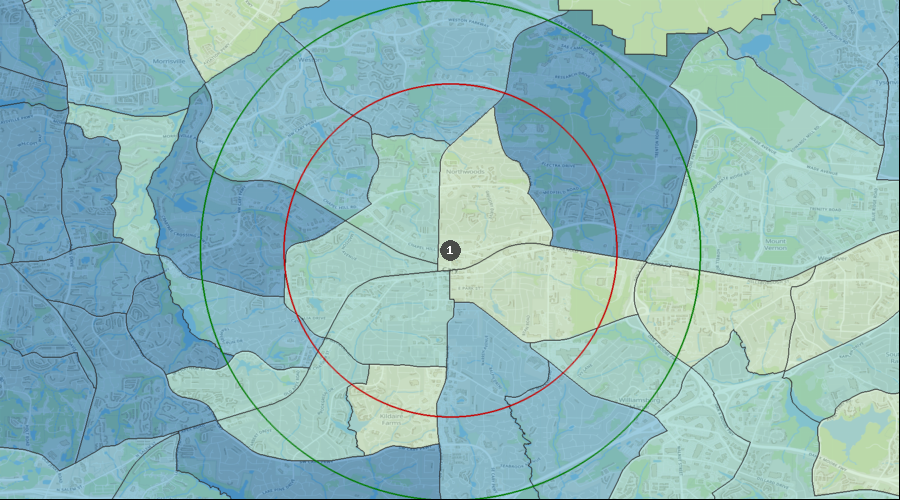
Dental Services per HH (Avg by Census Tract) | $584 to $909 |
| $453 to $584 |
| $330 to $453 |
| $0 to $330 |
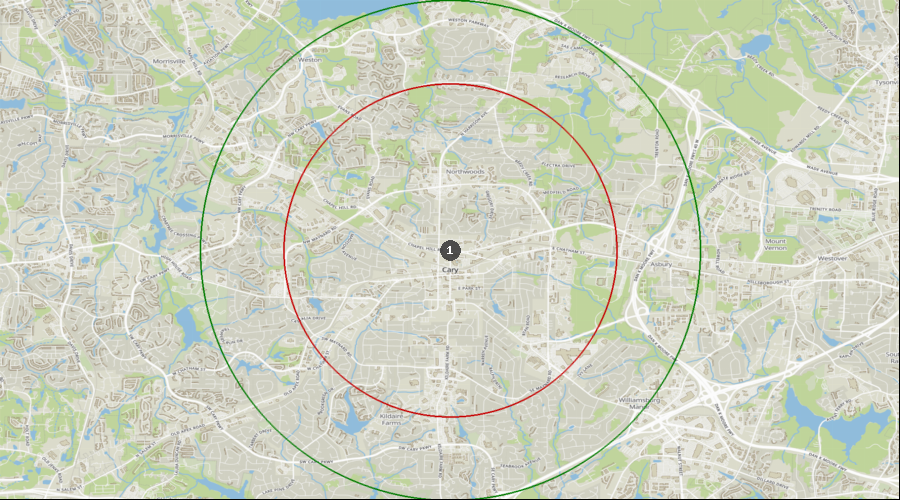
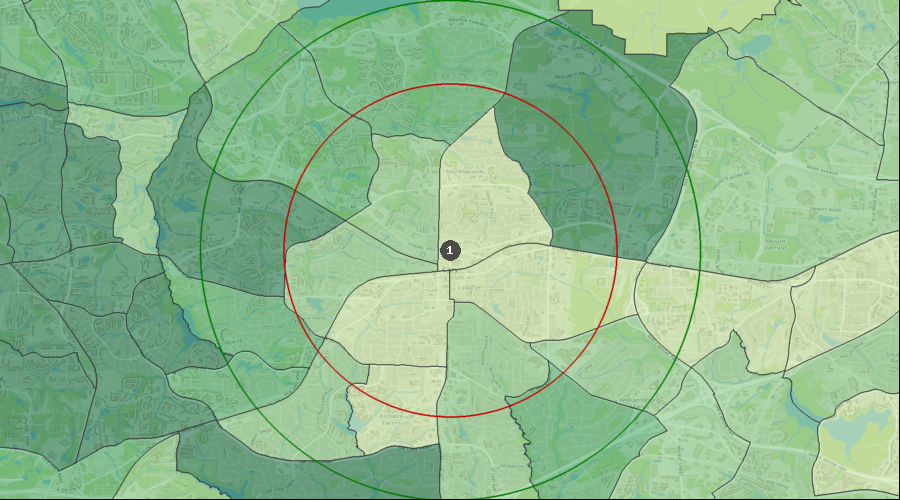
| 1. | Cary |
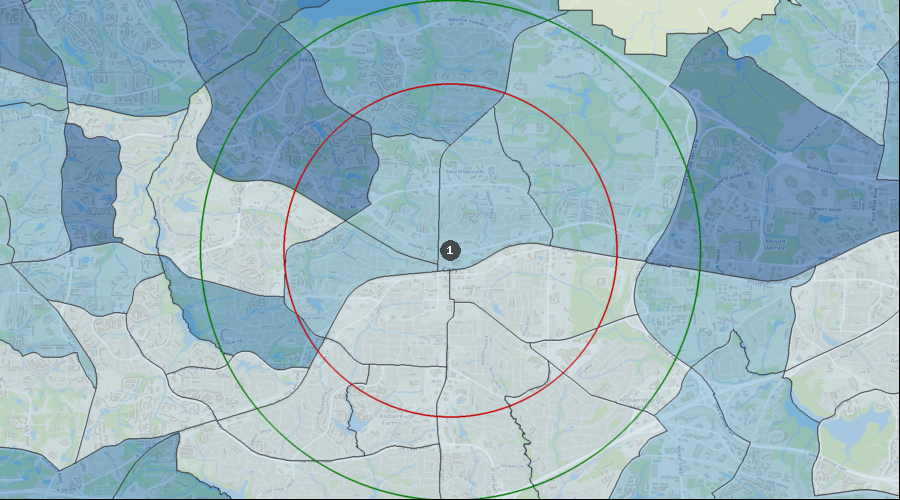
Percentage of the Population Visiting a Dentist in the Last 12 Months
Visited a Dentist in Past 12 Months | 35.31% to 38.99% |
| 31.78% to 35.31% |
| 26.94% to 31.78% |
| 0.00% to 26.94% |
| 1. | Cary |
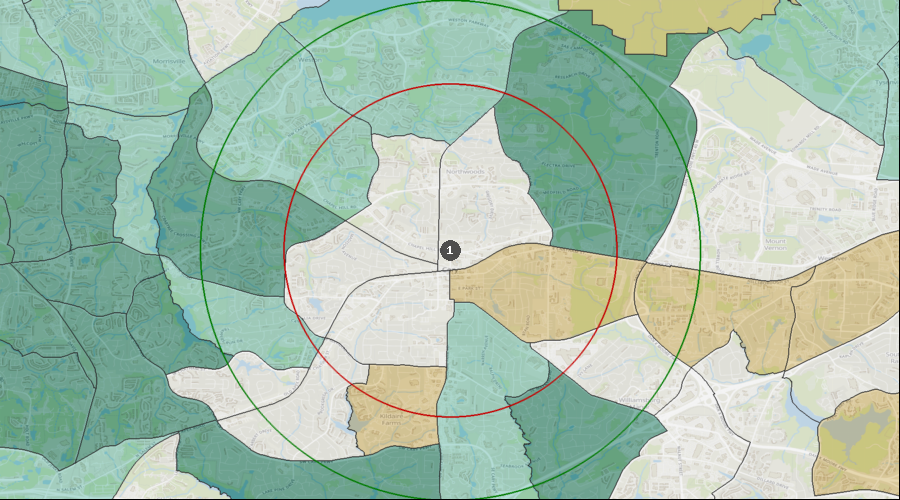
Percentage of the Population with a Bachelor's Degree
Education: Bach Deg by Census Tract | 72.35% to 82.71% |
| 61.42% to 72.35% |
| 50.02% to 61.42% |
| 27.27% to 50.02% |
| 1. | Cary |
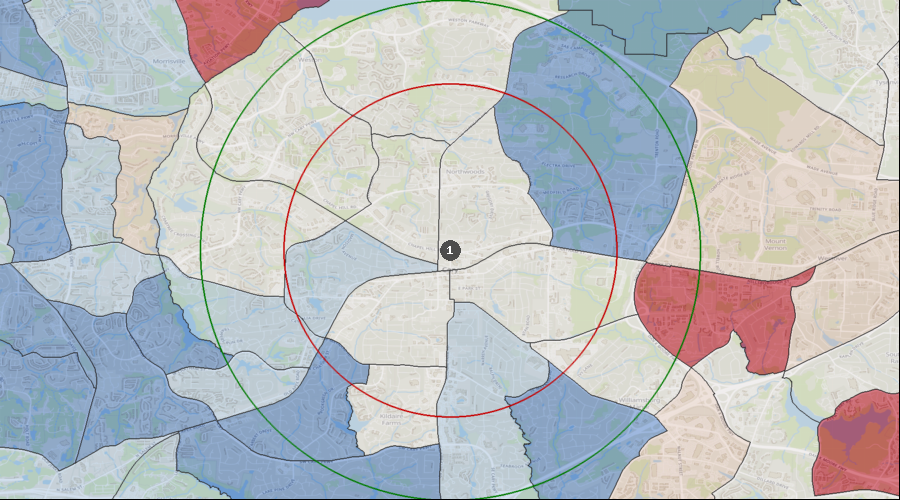
Lifestyle Behaviors – Household Entertainment/Recreation Average Expenditure
Ent/Recreation Per HH (Avg by Census Tract) | $4,963 to $7,629 |
| $3,990 to $4,963 |
| $2,937 to $3,990 |
| $0 to $2,937 |
| 1. | Cary |
Projected Population Growth Rate
Projected Population Growth Per Year | 3.23% to 5.14% |
| 2.14% to 3.23% |
| 1.38% to 2.14% |
| 0.01% to 1.38% |
| 0.00% to 0.01% |
| 1. | Cary |
Average Household Expenditure for Health Insurance
Health Insurance Avg/HH by Census Tract | $5,563 to $8,751 |
| $4,437 to $5,563 |
| $2,986 to $4,437 |
| $0 to $2,986 |
| 1. | Cary |
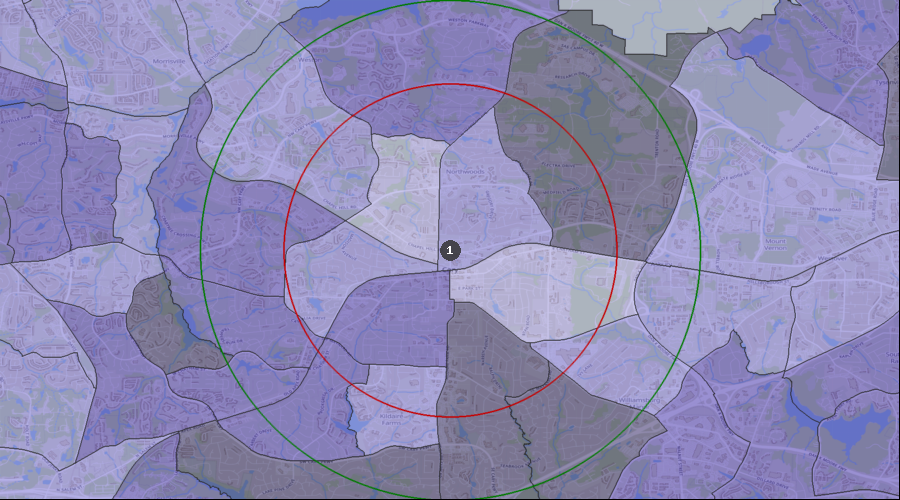
Home Ownership Rates
Owner Occupied Households by Census Tract | 70.24% to 92.43% |
| 47.52% to 70.24% |
| 33.38% to 47.52% |
| 23.20% to 33.38% |
| 17.39% to 23.20% |
| 1. | Cary |
Median Household Income
Median Household Income by Census Tract | $114k to $173k |
| $89k to $114k |
| $64k to $89k |
| $0k to $64k |
| 1. | Cary |
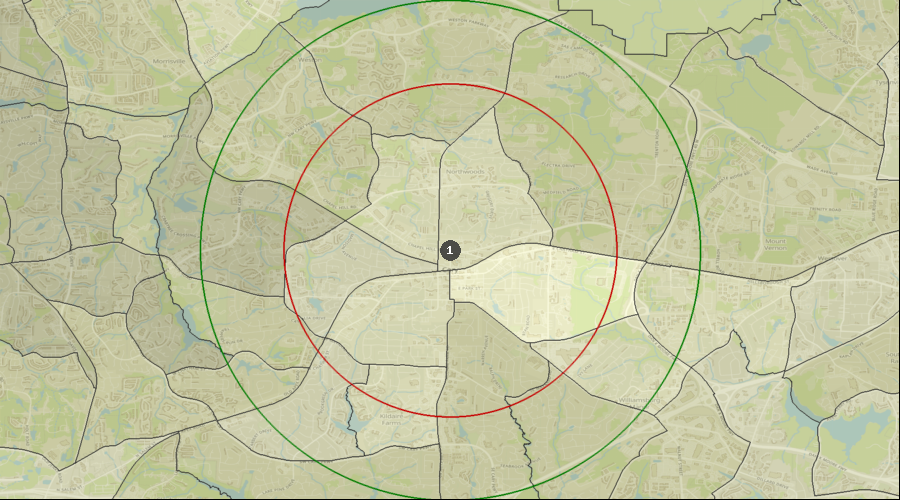
Daily Average Traffic Count
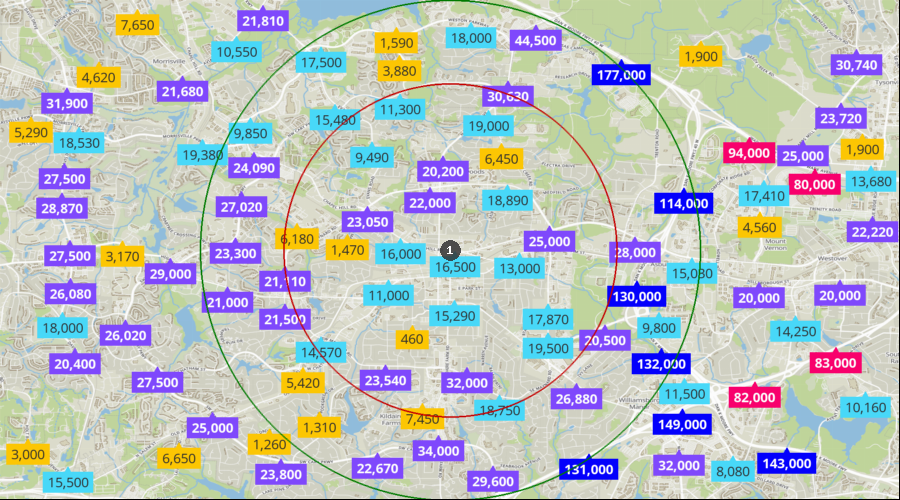
Traffic Counts | 103k to 177k |
| 45k to 103k |
| 20k to 45k |
| 8k to 20k |
| 0k to 8k |
| 1. | Cary |