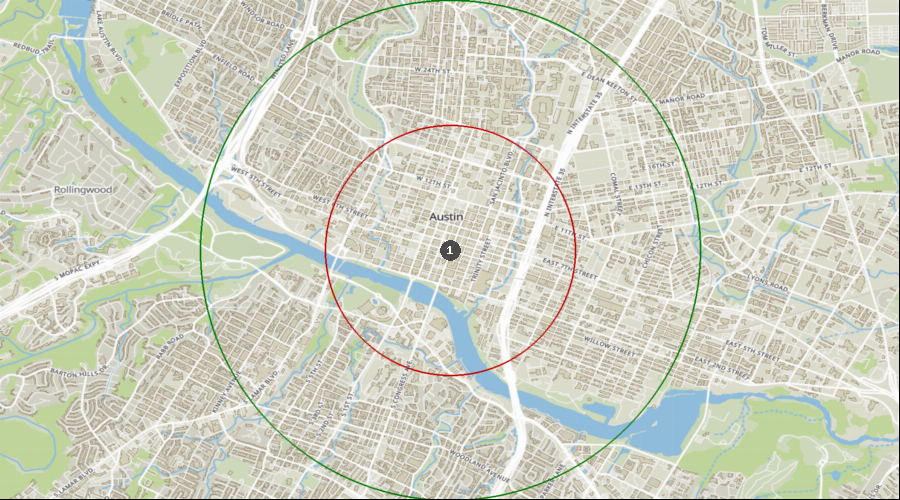
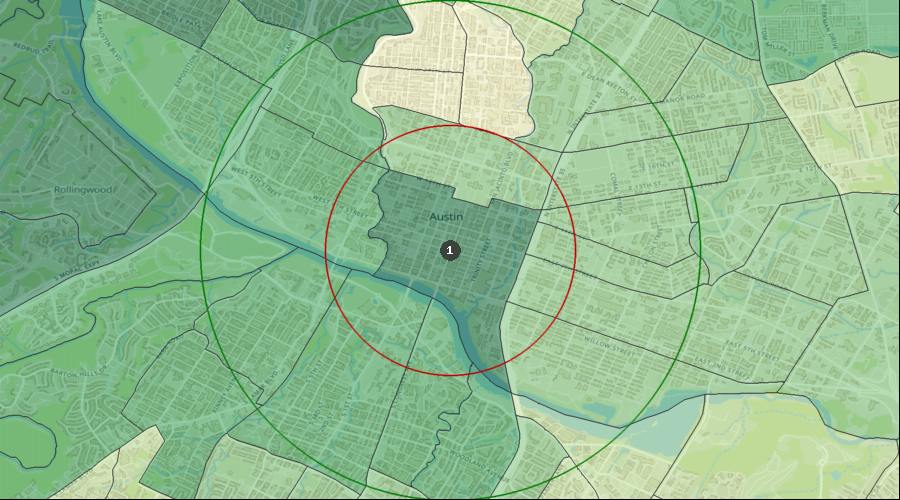
Austin, Texas - Dental Demographics Maps
Want comprehensive data on dentist to population ratios?
A Denali Demographic Study looks at the information in demographic reports like historical data, market saturation, growth drivers, and dental specific statistics, and interprets all these dental demographics to provide a viability ranking that other demographic reports typically don’t provide.
Get a custom study for as little as $159
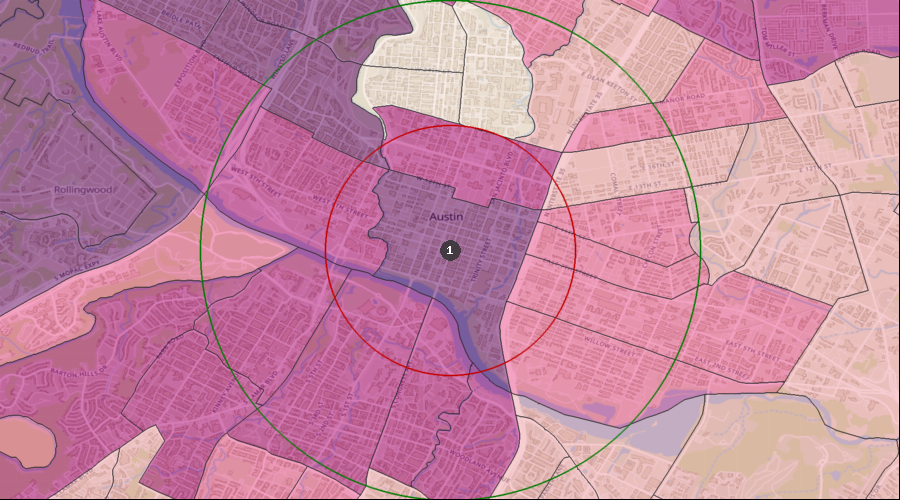
Average Dental Expenditures
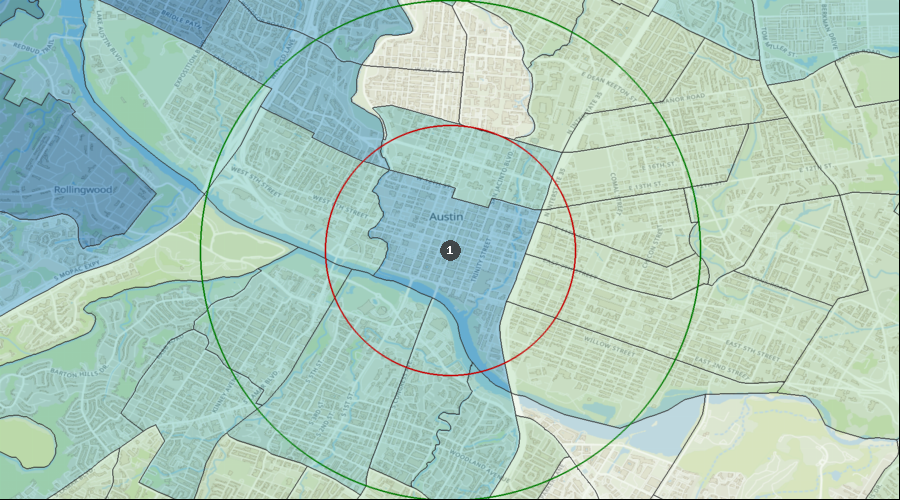
Dental Services per HH (Avg by Census Tract) | $906 to $1,121 |
| $623 to $906 |
| $378 to $623 |
| $222 to $378 |
| $63 to $222 |
| 1. | Austin |
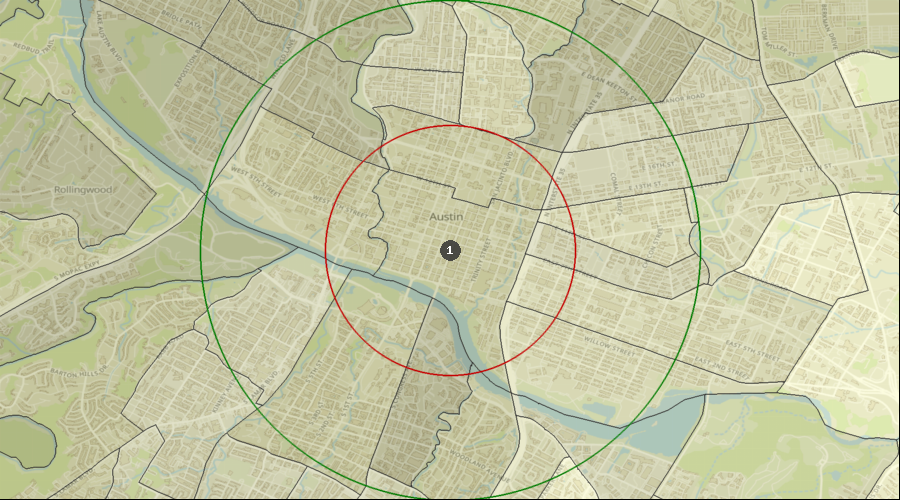
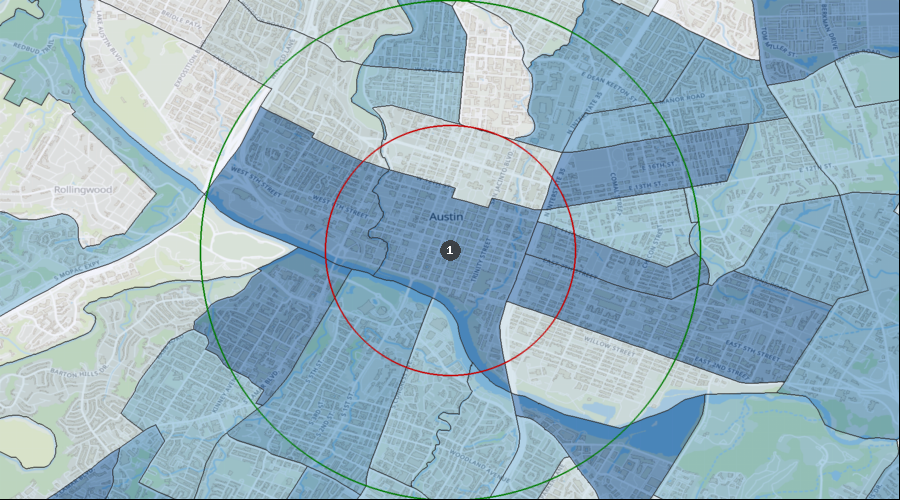
Percentage of the Population Visiting a Dentist in the Last 12 Months
Visited a Dentist in Past 12 Months | 35.73% to 40.58% |
| 31.94% to 35.73% |
| 27.21% to 31.94% |
| 20.74% to 27.21% |
| 17.23% to 20.74% |
| 1. | Austin |
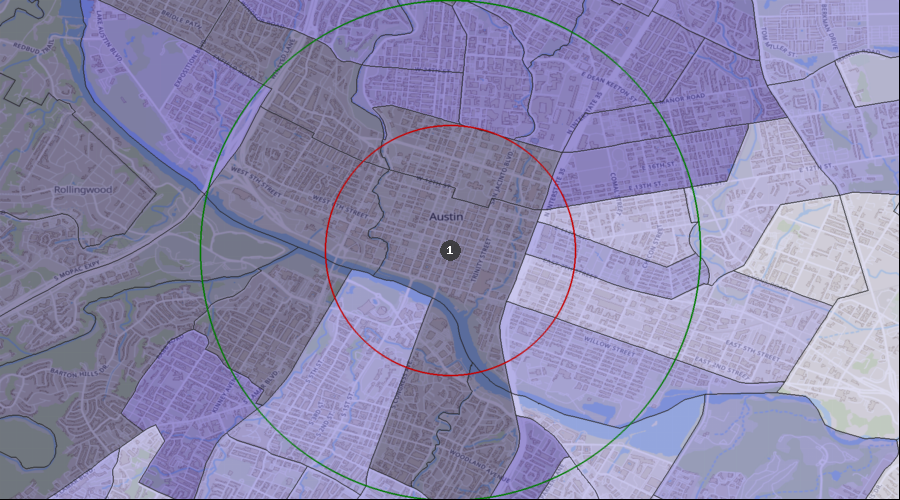
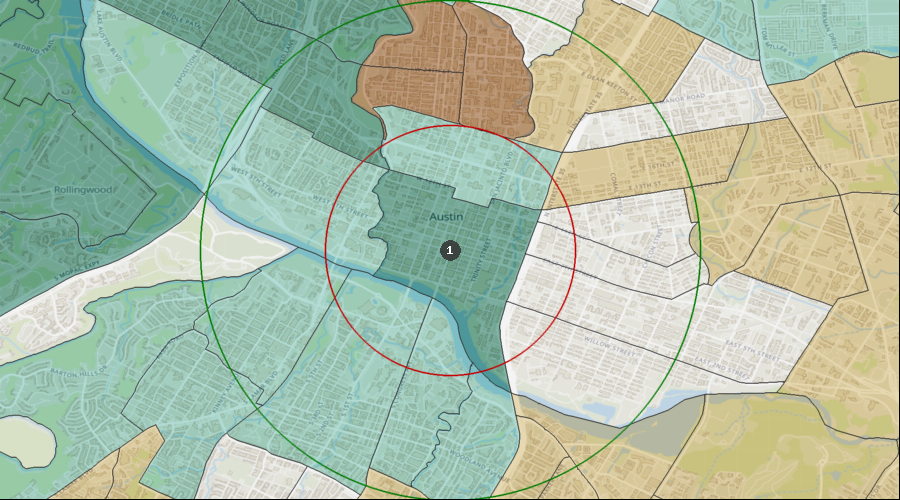
Percentage of the Population with a Bachelor's Degree
Education: Bach Deg by Census Tract | 78.38% to 92.69% |
| 65.87% to 78.38% |
| 47.28% to 65.87% |
| 30.01% to 47.28% |
| 7.74% to 30.01% |
| 1. | Austin |
Lifestyle Behaviors – Household Entertainment/Recreation Average Expenditure
Ent/Recreation Per HH (Avg by Census Tract) | $5,450 to $8,742 |
| $3,303 to $5,450 |
| $2,562 to $3,303 |
| $1,262 to $2,562 |
| $678 to $1,262 |
| 1. | Austin |
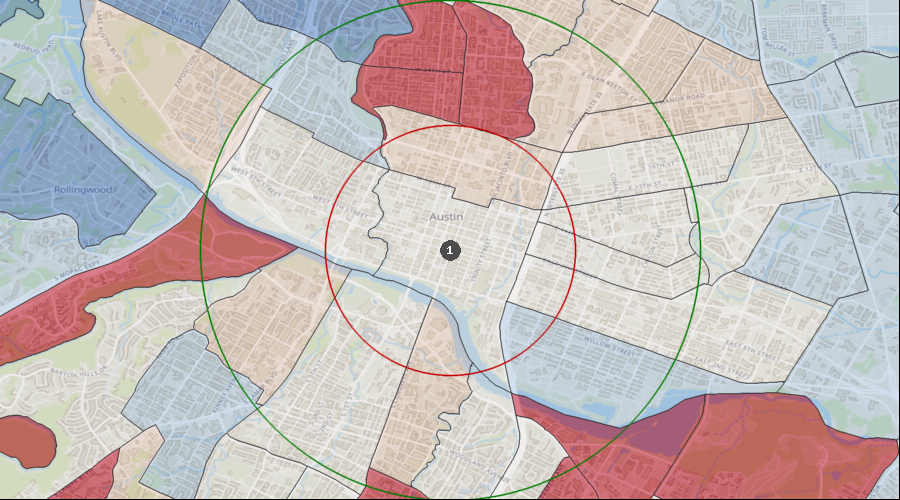
Projected Population Growth Rate
Projected Population Growth Per Year | 2.73% to 6.69% |
| 1.74% to 2.73% |
| 1.17% to 1.74% |
| 0.76% to 1.17% |
| 0.19% to 0.76% |
| 1. | Austin |
Average Household Expenditure for Health Insurance
Health Insurance Avg/HH by Census Tract | $5,833 to $9,858 |
| $3,769 to $5,833 |
| $2,971 to $3,769 |
| $1,369 to $2,971 |
| $735 to $1,369 |
| 1. | Austin |
Home Ownership Rates
Owner Occupied Households by Census Tract | 55.60% to 86.72% |
| 42.08% to 55.60% |
| 30.36% to 42.08% |
| 13.67% to 30.36% |
| 0.00% to 13.67% |
| 1. | Austin |
Median Household Income
Median Household Income by Census Tract | $107k to $171k |
| $69k to $107k |
| $48k to $69k |
| $20k to $48k |
| $11k to $20k |
| 1. | Austin |
Daily Average Traffic Count
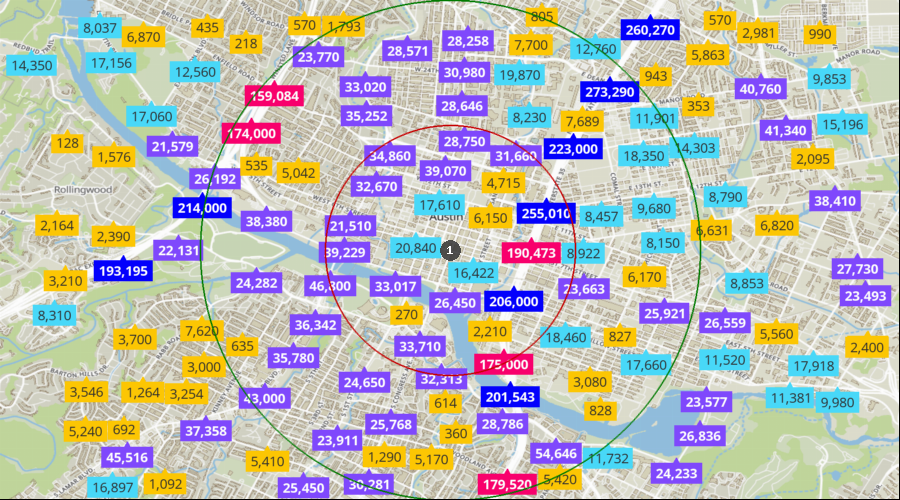
Traffic Counts | 193k to 273k |
| 55k to 193k |
| 21k to 55k |
| 8k to 21k |
| 0k to 8k |
| 1. | Austin |