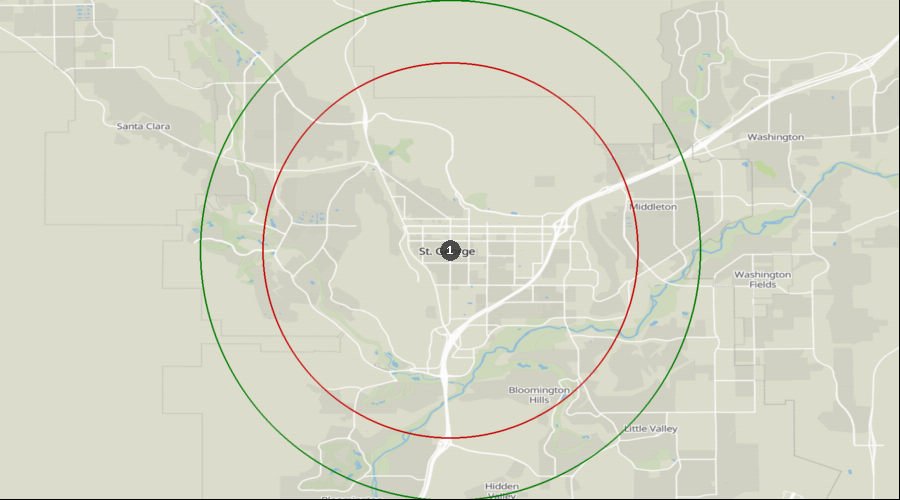
St. George, Utah - Dental Demographics Maps
Want comprehensive data on dentist to population ratios?
A Denali Demographic Study looks at the information in demographic reports like historical data, market saturation, growth drivers, and dental specific statistics, and interprets all these dental demographics to provide a viability ranking that other demographic reports typically don’t provide.
Get a custom study for as little as $159
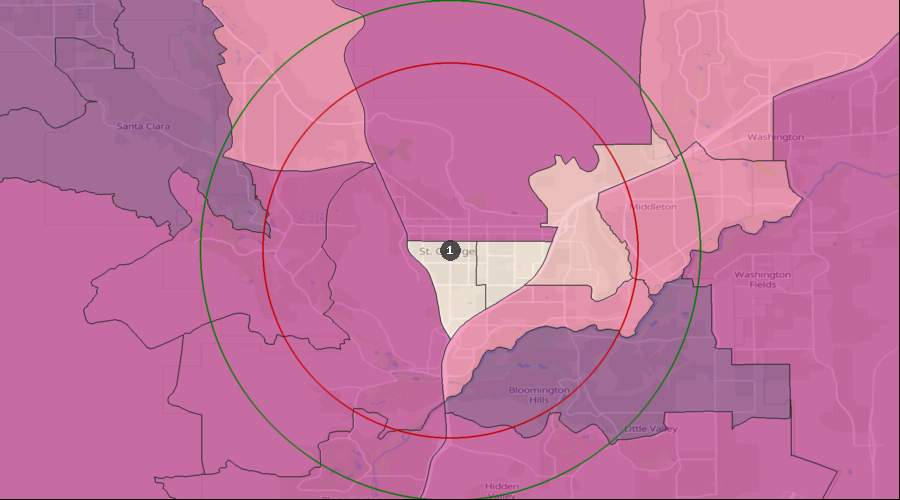
Average Dental Expenditures
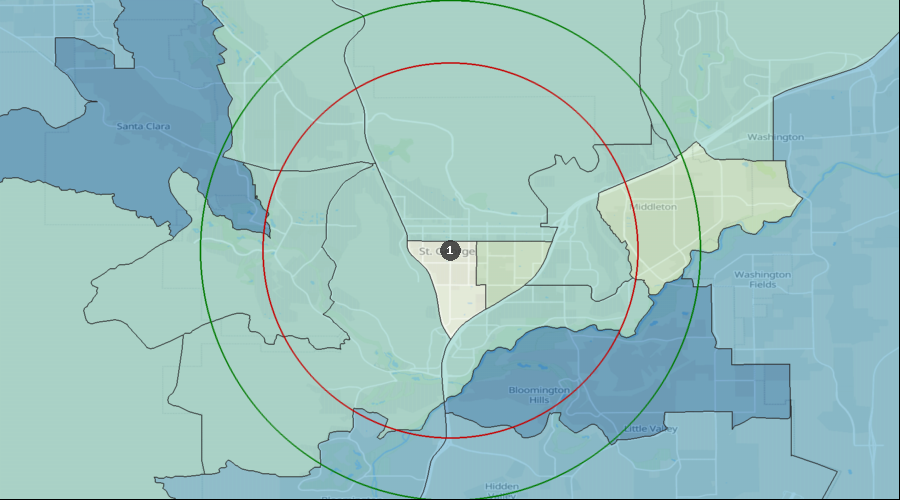
Dental Services per HH (Avg by Census Tract) | $395 to $496 |
| $353 to $395 |
| $285 to $353 |
| $226 to $285 |
| $207 to $226 |
| 1. | St. George |
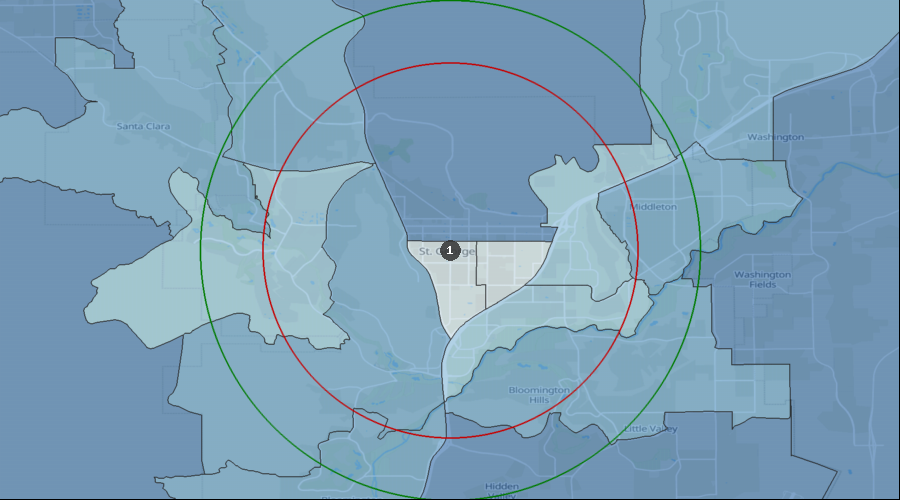
Percentage of the Population Visiting a Dentist in the Last 12 Months
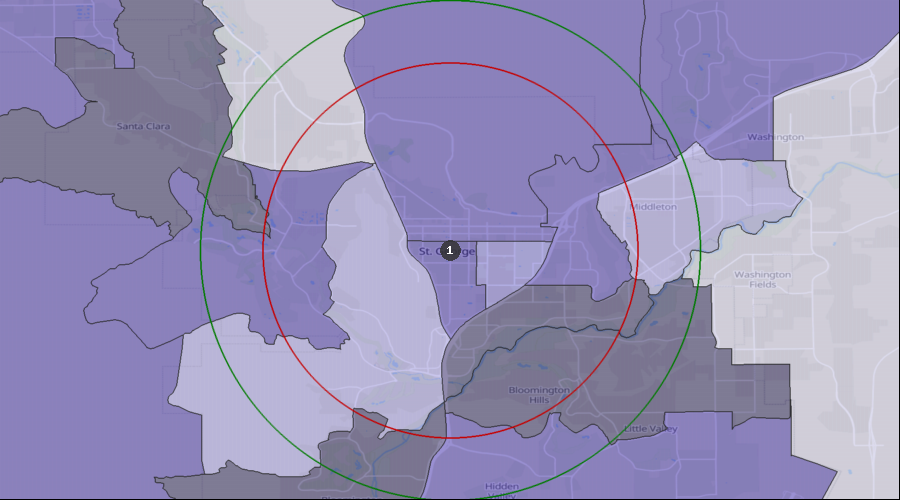
Visited a Dentist in Past 12 Months | 29.87% to 41.66% |
| 27.02% to 29.87% |
| 25.83% to 27.02% |
| 24.04% to 25.83% |
| 23.39% to 24.04% |
| 1. | St. George |
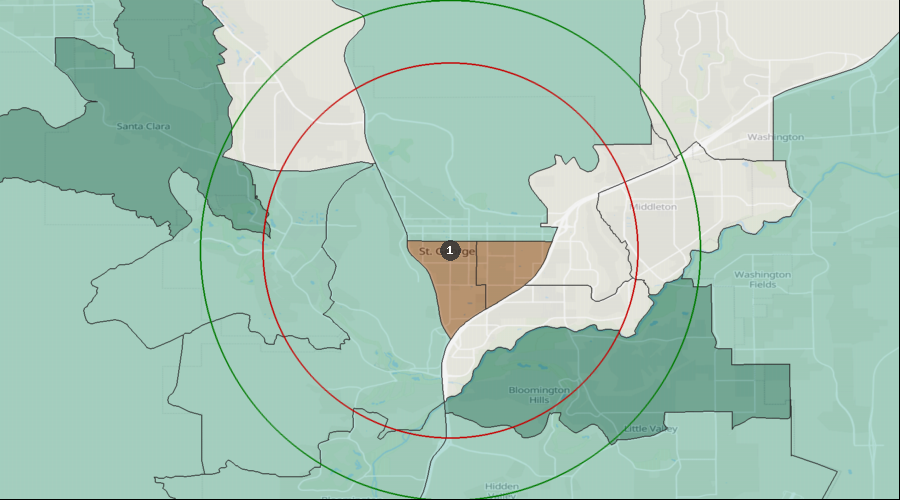
Percentage of the Population with a Bachelor's Degree
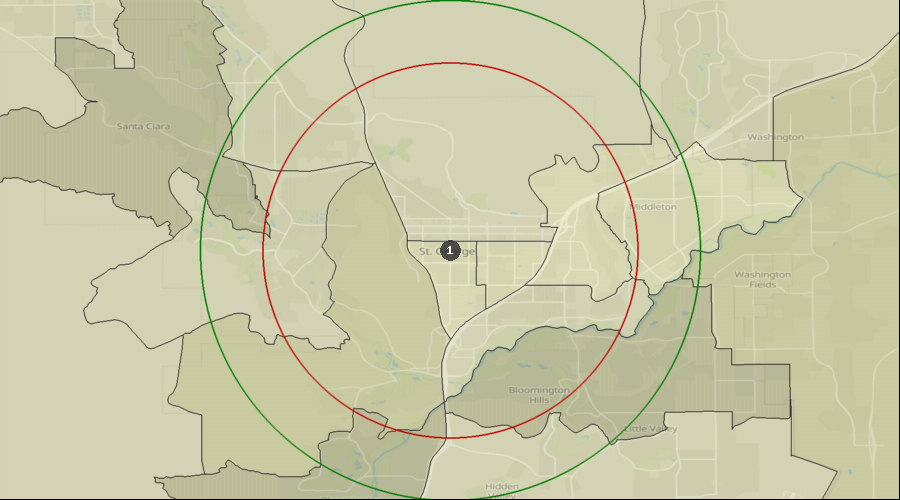
Education: Bach Deg by Census Tract | 38.43% to 44.32% |
| 32.93% to 38.43% |
| 27.44% to 32.93% |
| 18.40% to 27.44% |
| 1. | St. George |
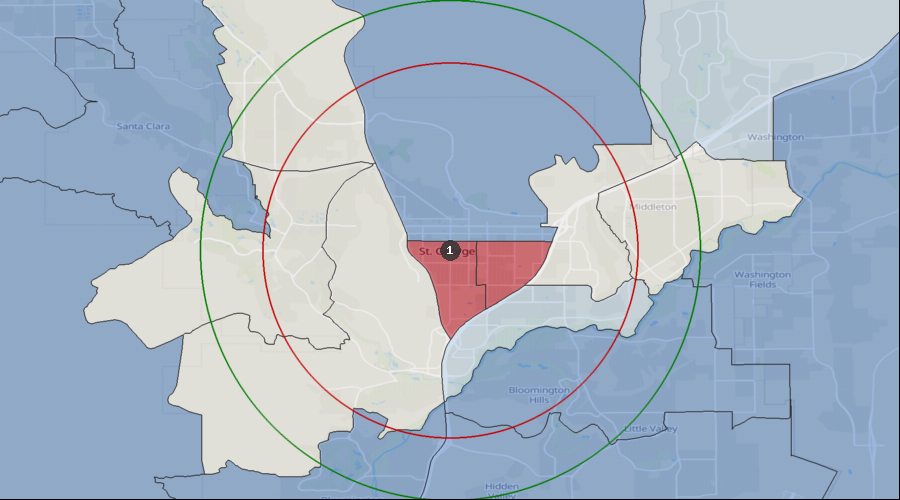
Lifestyle Behaviors – Household Entertainment/Recreation Average Expenditure
Ent/Recreation Per HH (Avg by Census Tract) | $3,258 to $4,441 |
| $2,746 to $3,258 |
| $2,220 to $2,746 |
| $1,921 to $2,220 |
| $1,689 to $1,921 |
| 1. | St. George |
Projected Population Growth Rate
Projected Population Growth Per Year | 2.85% to 4.82% |
| 1.90% to 2.85% |
| 1.29% to 1.90% |
| 0.67% to 1.29% |
| 1. | St. George |
Average Household Expenditure for Health Insurance
Health Insurance Avg/HH by Census Tract | $3,977 to $5,402 |
| $3,363 to $3,977 |
| $2,630 to $3,363 |
| $2,295 to $2,630 |
| $2,098 to $2,295 |
| 1. | St. George |
Home Ownership Rates
Owner Occupied Households by Census Tract | 60.20% to 76.09% |
| 52.31% to 60.20% |
| 41.51% to 52.31% |
| 37.23% to 41.51% |
| 33.48% to 37.23% |
| 1. | St. George |
Median Household Income
Median Household Income by Census Tract | $61k to $95k |
| $58k to $61k |
| $52k to $58k |
| $36k to $52k |
| 1. | St. George |
Daily Average Traffic Count
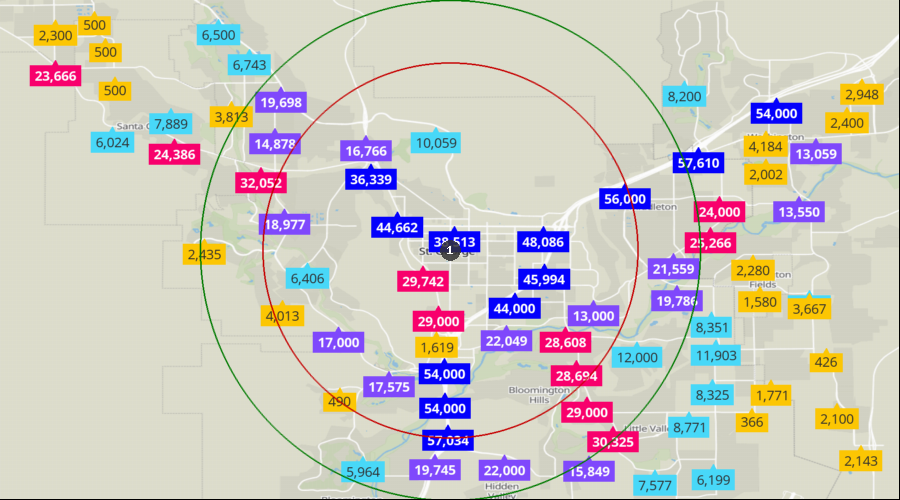
Traffic Counts | 36k to 58k |
| 23k to 36k |
| 13k to 23k |
| 5k to 13k |
| 0k to 5k |
| 1. | St. George |