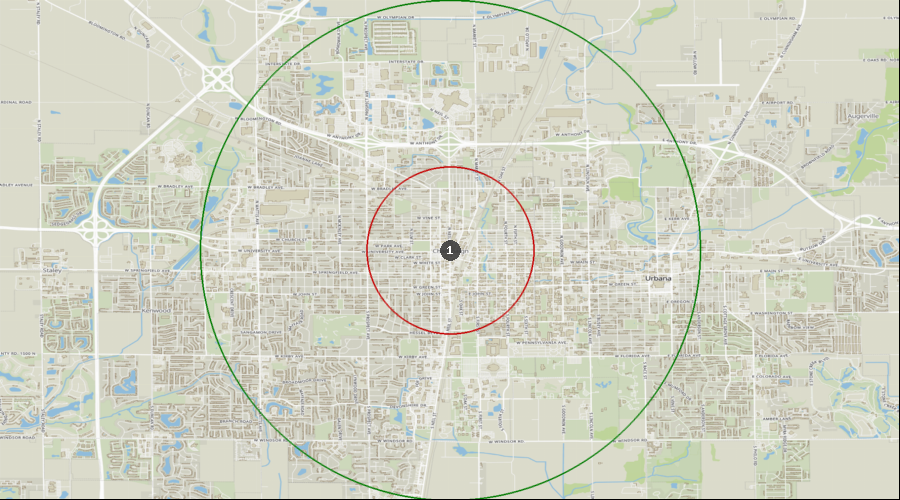
Champaign, Illinois - Dental Demographics Maps
Want comprehensive data on dentist to population ratios?
A Denali Demographic Study looks at the information in demographic reports like historical data, market saturation, growth drivers, and dental specific statistics, and interprets all these dental demographics to provide a viability ranking that other demographic reports typically don’t provide.
Get a custom study for as little as $159
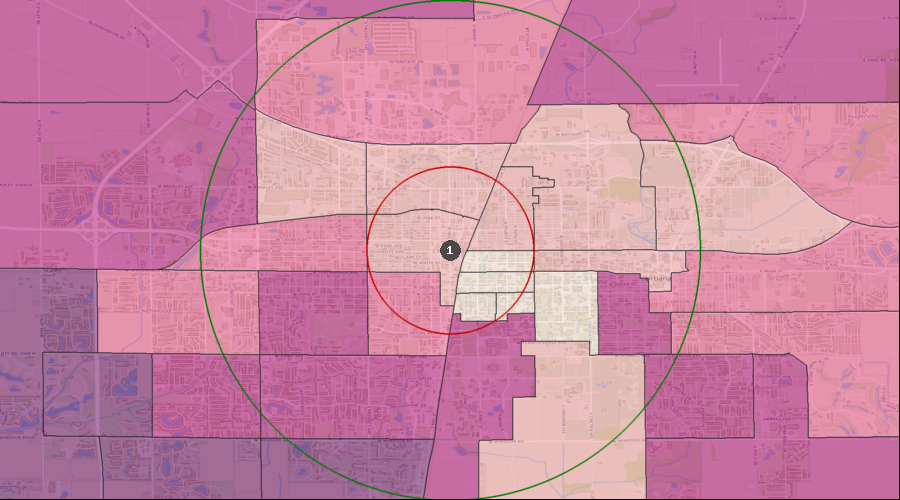
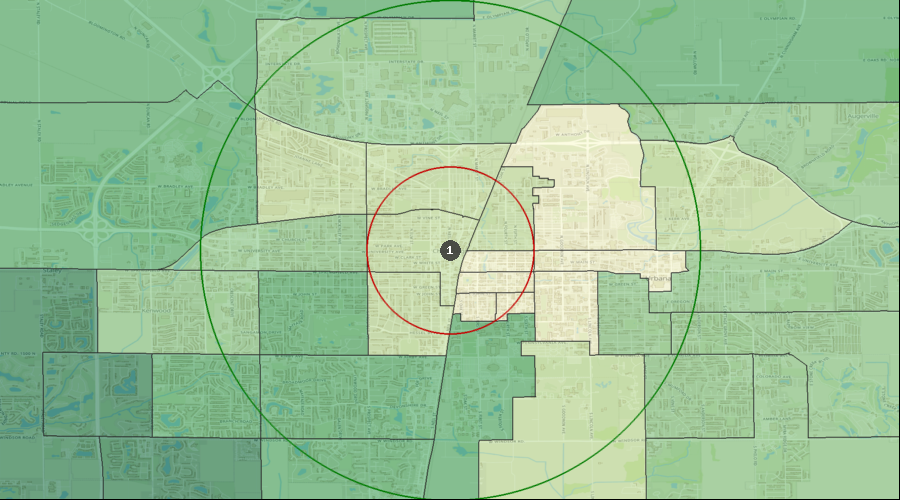
Average Dental Expenditures
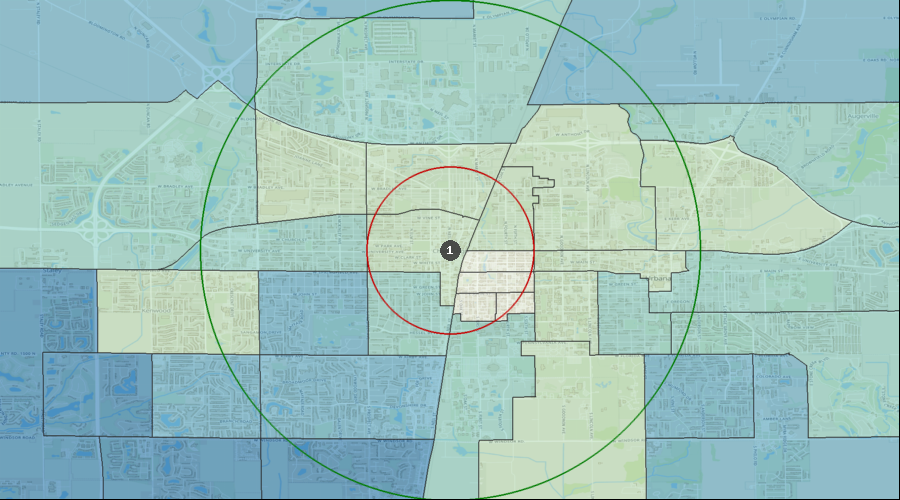
Dental Services per HH (Avg by Census Tract) | $460 to $710 |
| $361 to $460 |
| $232 to $361 |
| $71 to $232 |
| $48 to $71 |
| 1. | Champaign |
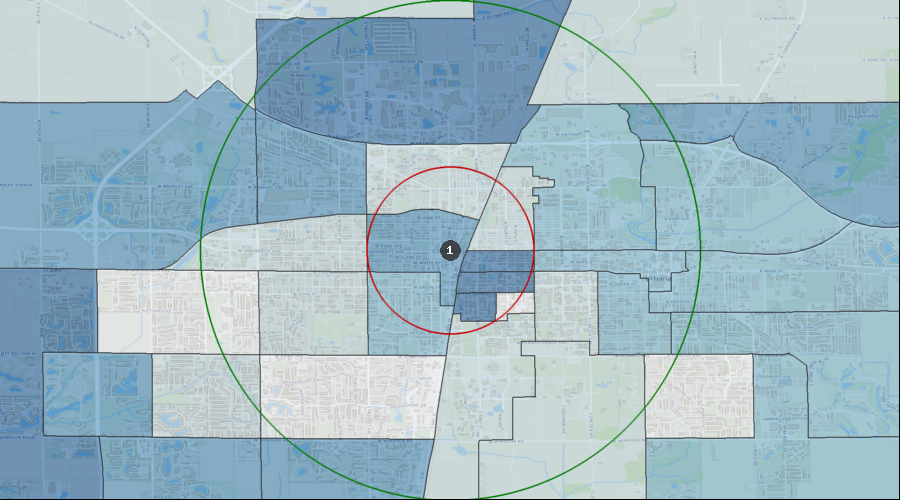
Percentage of the Population Visiting a Dentist in the Last 12 Months
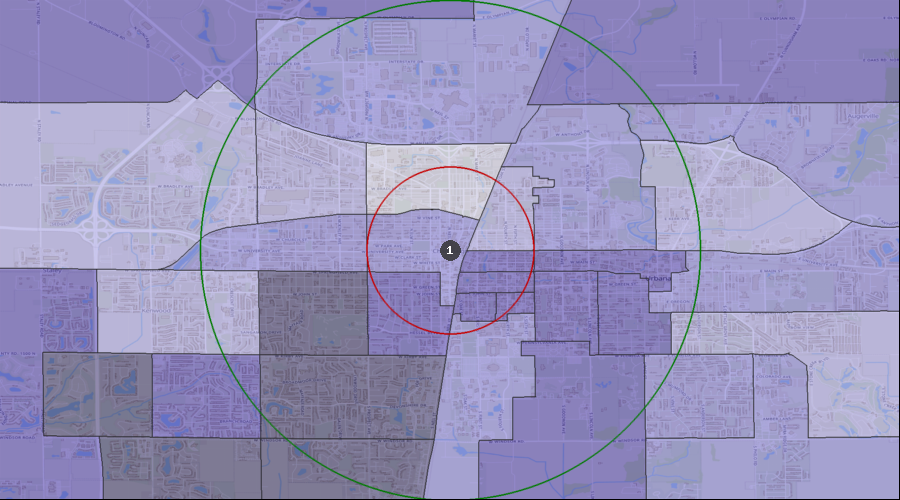
Visited a Dentist in Past 12 Months | 35.40% to 44.18% |
| 32.07% to 35.40% |
| 25.50% to 32.07% |
| 20.01% to 25.50% |
| 19.21% to 20.01% |
| 1. | Champaign |
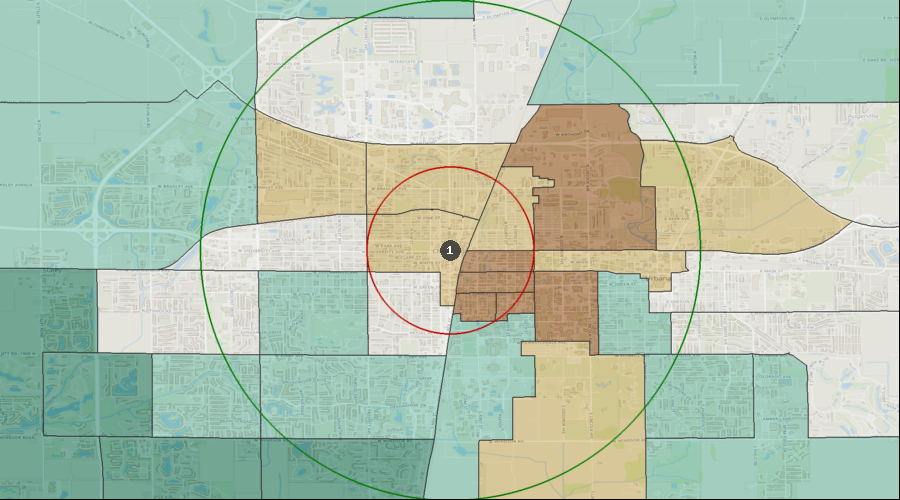
Percentage of the Population with a Bachelor's Degree
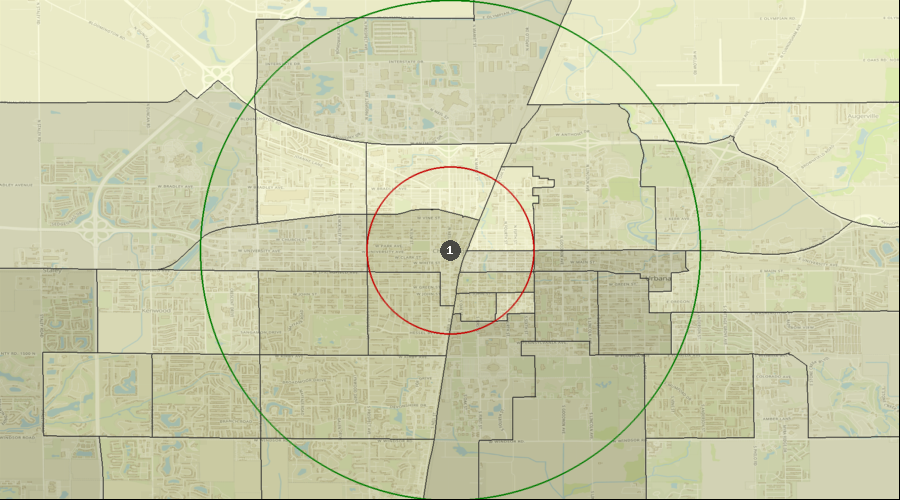
Education: Bach Deg by Census Tract | 67.39% to 91.20% |
| 57.17% to 67.39% |
| 43.00% to 57.17% |
| 27.46% to 43.00% |
| 14.51% to 27.46% |
| 1. | Champaign |
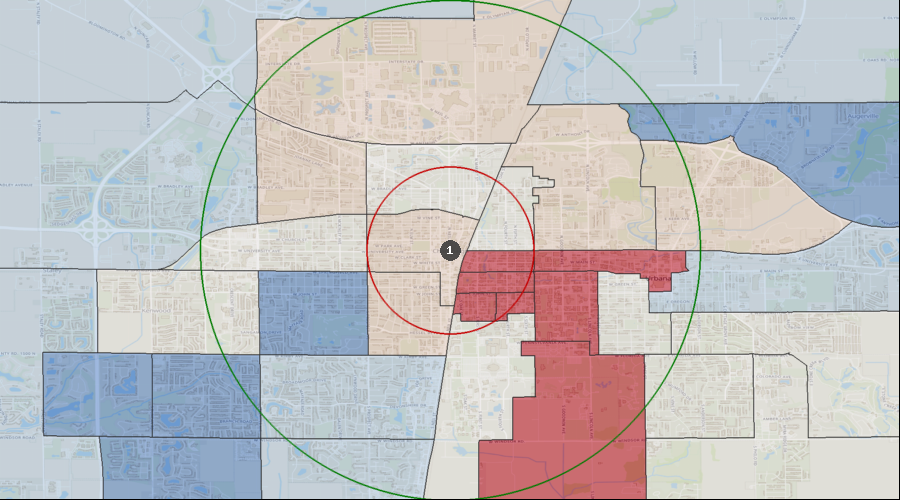
Lifestyle Behaviors – Household Entertainment/Recreation Average Expenditure
Ent/Recreation Per HH (Avg by Census Tract) | $4,034 to $6,451 |
| $3,105 to $4,034 |
| $2,084 to $3,105 |
| $1,110 to $2,084 |
| $477 to $1,110 |
| 1. | Champaign |
Projected Population Growth Rate
Projected Population Growth Per Year | 1.15% to 1.96% |
| 0.78% to 1.15% |
| 0.51% to 0.78% |
| 0.23% to 0.51% |
| -0.06% to 0.23% |
| 1. | Champaign |
Average Household Expenditure for Health Insurance
Health Insurance Avg/HH by Census Tract | $4,901 to $7,654 |
| $3,621 to $4,901 |
| $2,523 to $3,621 |
| $1,259 to $2,523 |
| $517 to $1,259 |
| 1. | Champaign |
Home Ownership Rates
Owner Occupied Households by Census Tract | 67.11% to 82.28% |
| 53.49% to 67.11% |
| 37.83% to 53.49% |
| 13.86% to 37.83% |
| 0.17% to 13.86% |
| 1. | Champaign |
Median Household Income
Median Household Income by Census Tract | $91k to $137k |
| $65k to $91k |
| $44k to $65k |
| $22k to $44k |
| $10k to $22k |
| 1. | Champaign |
Daily Average Traffic Count
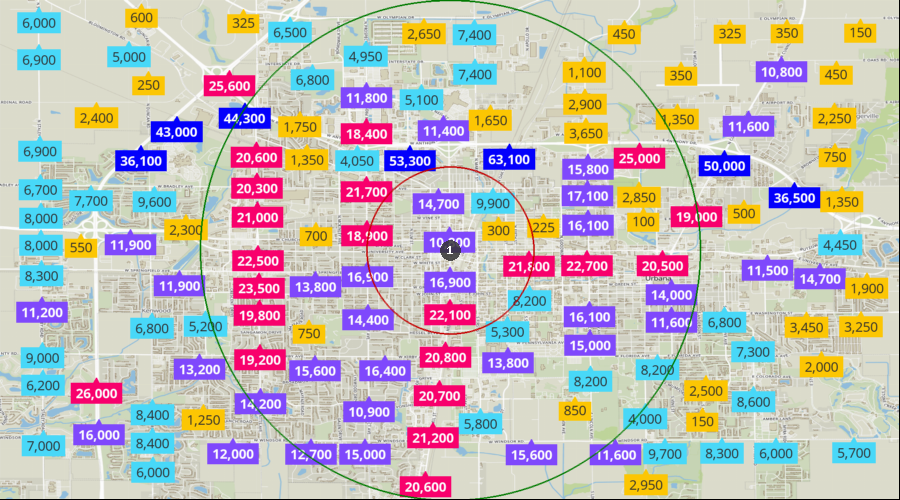
Traffic Counts | 33k to 63k |
| 18k to 33k |
| 10k to 18k |
| 4k to 10k |
| 0k to 4k |
| 1. | Champaign |