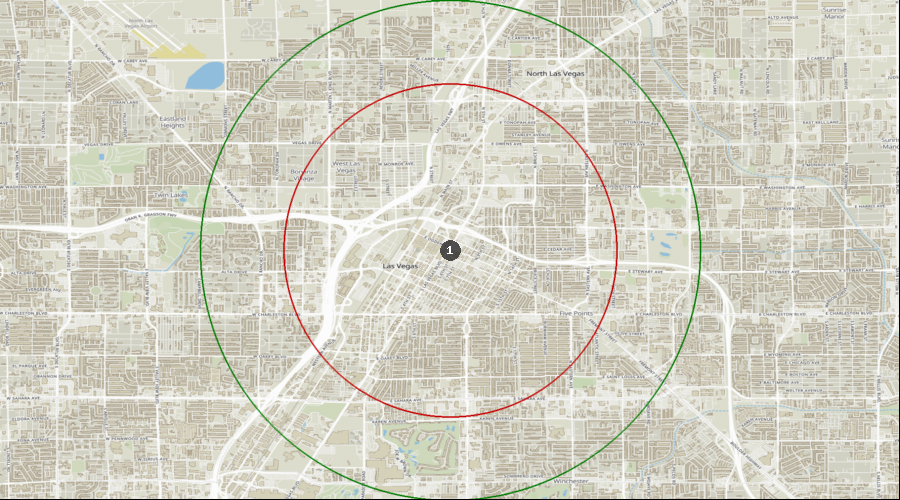
Las Vegas, Nevada - Dental Demographics Maps
Want comprehensive data on dentist to population ratios?
A Denali Demographic Study looks at the information in demographic reports like historical data, market saturation, growth drivers, and dental specific statistics, and interprets all these dental demographics to provide a viability ranking that other demographic reports typically don’t provide.
Get a custom study for as little as $159
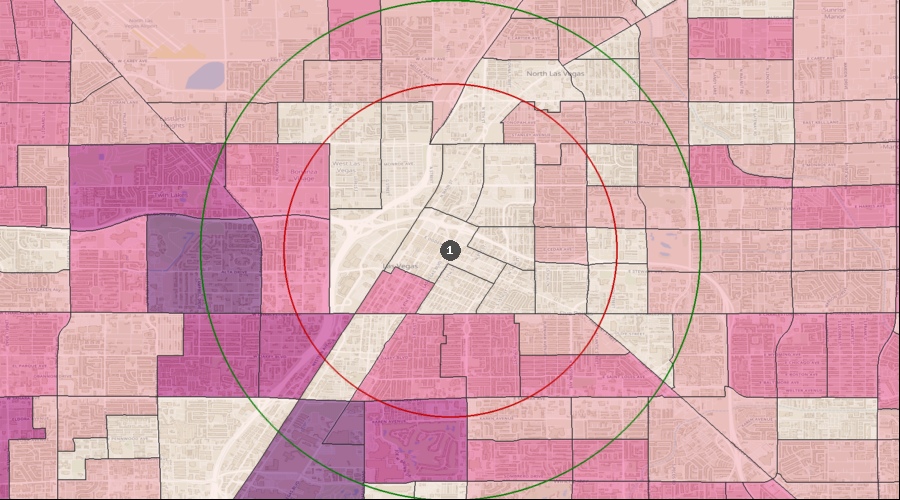
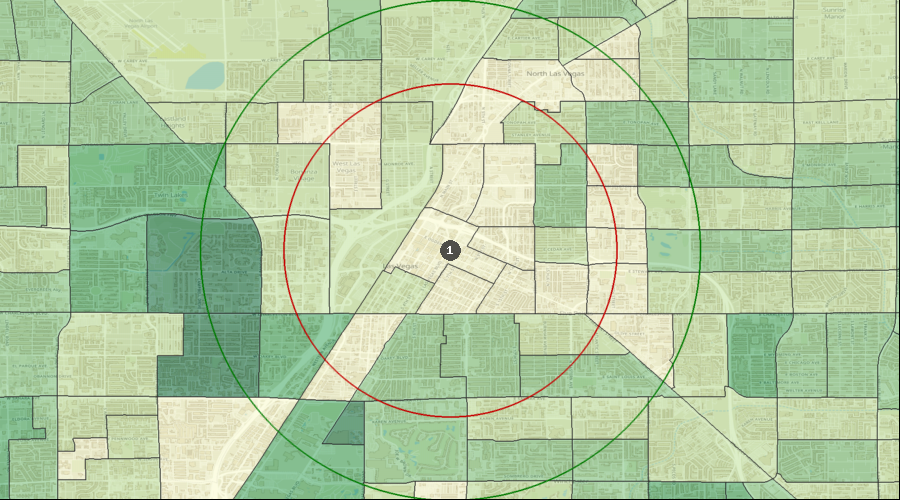
Average Dental Expenditures
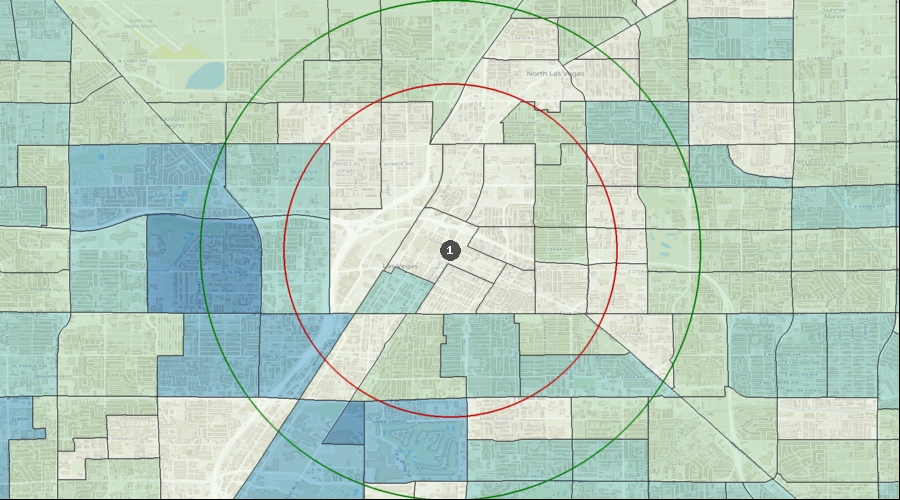
Dental Services per HH (Avg by Census Tract) | $516 to $1,025 |
| $321 to $516 |
| $237 to $321 |
| $169 to $237 |
| $100 to $169 |
| 1. | Las Vegas |
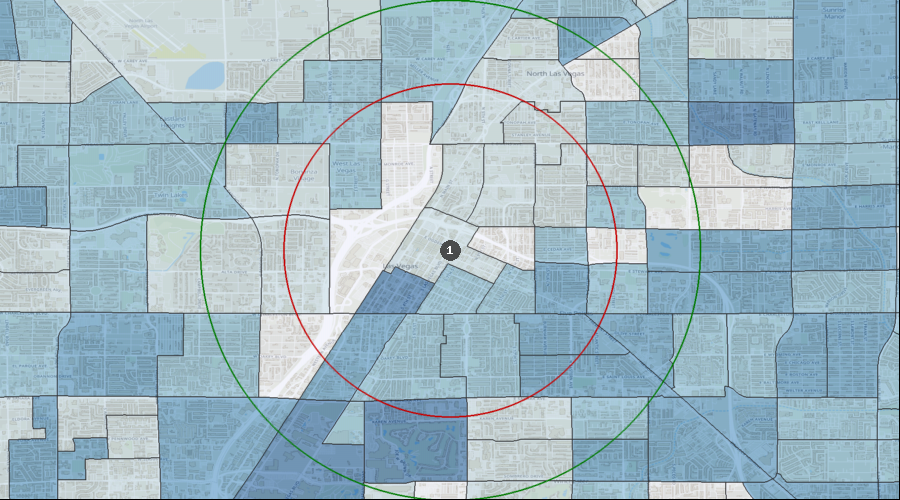
Percentage of the Population Visiting a Dentist in the Last 12 Months
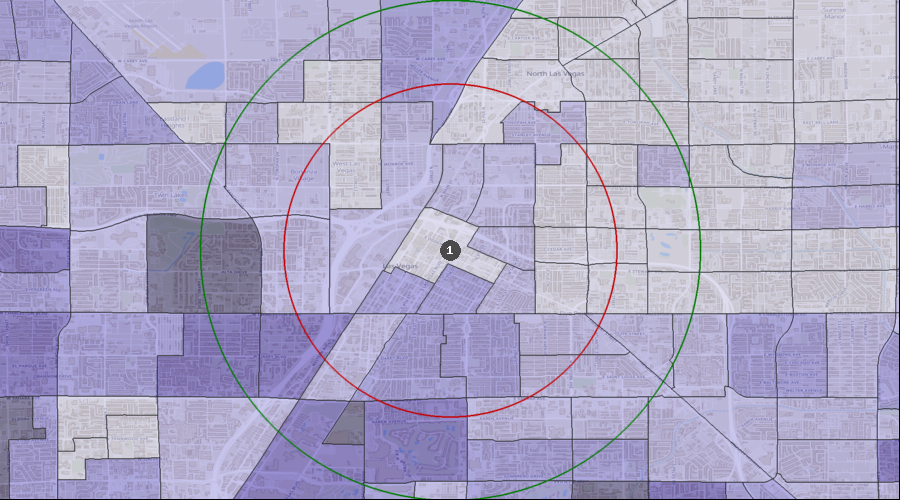
Visited a Dentist in Past 12 Months | 34.37% to 48.23% |
| 27.21% to 34.37% |
| 23.14% to 27.21% |
| 19.50% to 23.14% |
| 8.34% to 19.50% |
| 1. | Las Vegas |
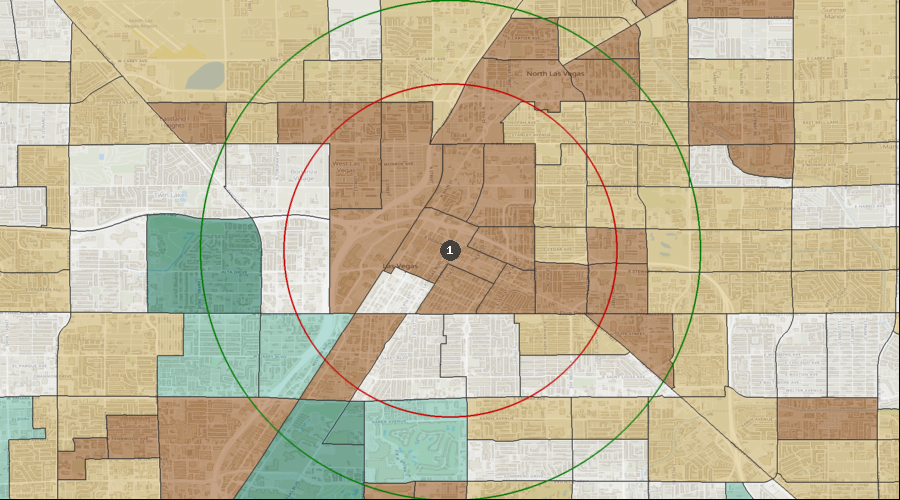
Percentage of the Population with a Bachelor's Degree
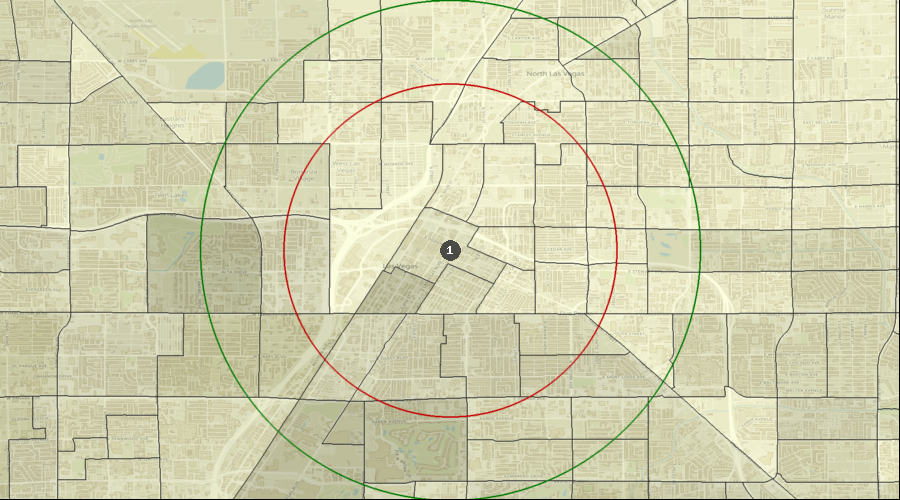
Education: Bach Deg by Census Tract | 38.74% to 56.62% |
| 22.94% to 38.74% |
| 14.59% to 22.94% |
| 8.10% to 14.59% |
| 1.42% to 8.10% |
| 1. | Las Vegas |
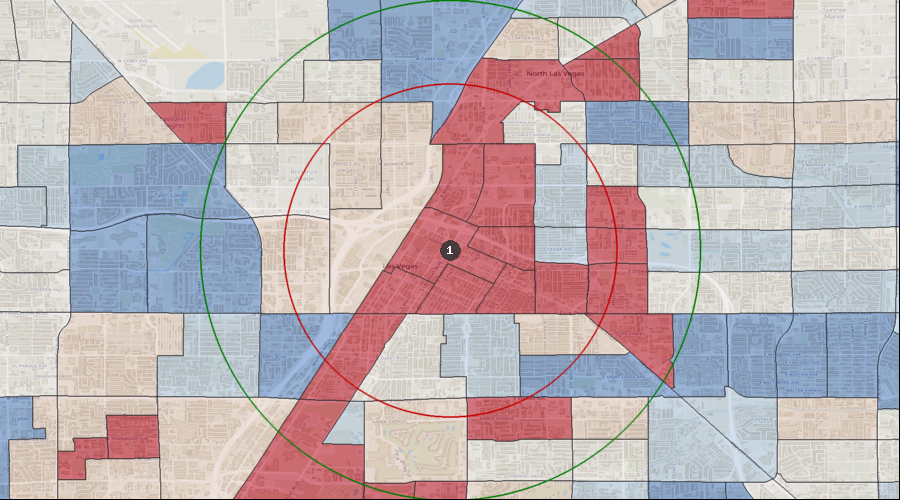
Lifestyle Behaviors – Household Entertainment/Recreation Average Expenditure
Ent/Recreation Per HH (Avg by Census Tract) | $3,901 to $6,930 |
| $2,750 to $3,901 |
| $2,038 to $2,750 |
| $1,461 to $2,038 |
| $879 to $1,461 |
| 1. | Las Vegas |
Projected Population Growth Rate
Projected Population Growth Per Year | 2.07% to 3.38% |
| 1.34% to 2.07% |
| 0.90% to 1.34% |
| 0.50% to 0.90% |
| -0.05% to 0.50% |
| 1. | Las Vegas |
Average Household Expenditure for Health Insurance
Health Insurance Avg/HH by Census Tract | $4,786 to $8,899 |
| $3,448 to $4,786 |
| $2,482 to $3,448 |
| $1,812 to $2,482 |
| $1,071 to $1,812 |
| 1. | Las Vegas |
Home Ownership Rates
Owner Occupied Households by Census Tract | 54.57% to 76.37% |
| 41.68% to 54.57% |
| 29.56% to 41.68% |
| 15.27% to 29.56% |
| 0.32% to 15.27% |
| 1. | Las Vegas |
Median Household Income
Median Household Income by Census Tract | $78k to $130k |
| $55k to $78k |
| $41k to $55k |
| $28k to $41k |
| $16k to $28k |
| 1. | Las Vegas |
Daily Average Traffic Count

Traffic Counts | 197k to 326k |
| 92k to 197k |
| 29k to 92k |
| 10k to 29k |
| 0k to 10k |
| 1. | Las Vegas |