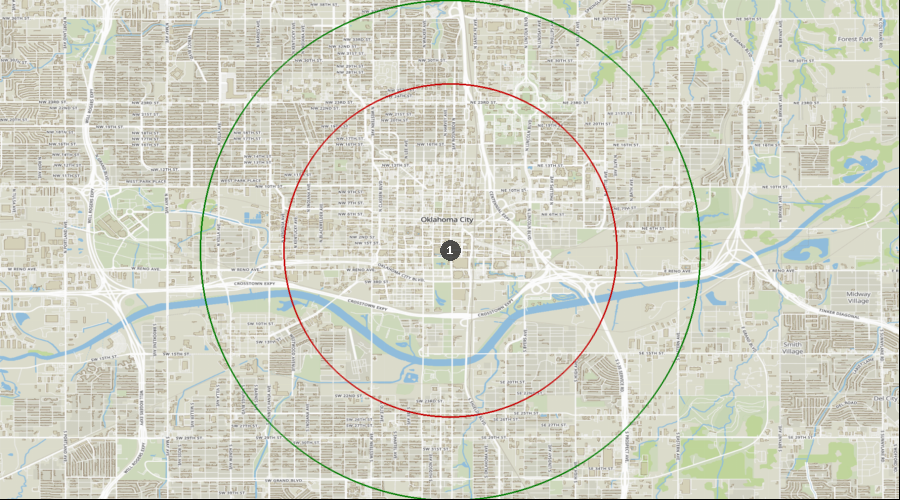
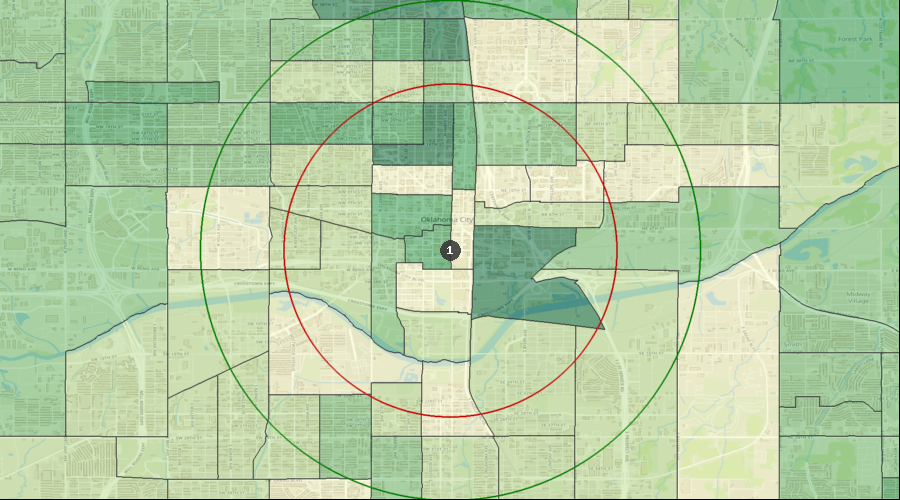
Oklahoma City, Oklahoma - Dental Demographics Maps
Want comprehensive data on dentist to population ratios?
A Denali Demographic Study looks at the information in demographic reports like historical data, market saturation, growth drivers, and dental specific statistics, and interprets all these dental demographics to provide a viability ranking that other demographic reports typically don’t provide.
Get a custom study for as little as $159
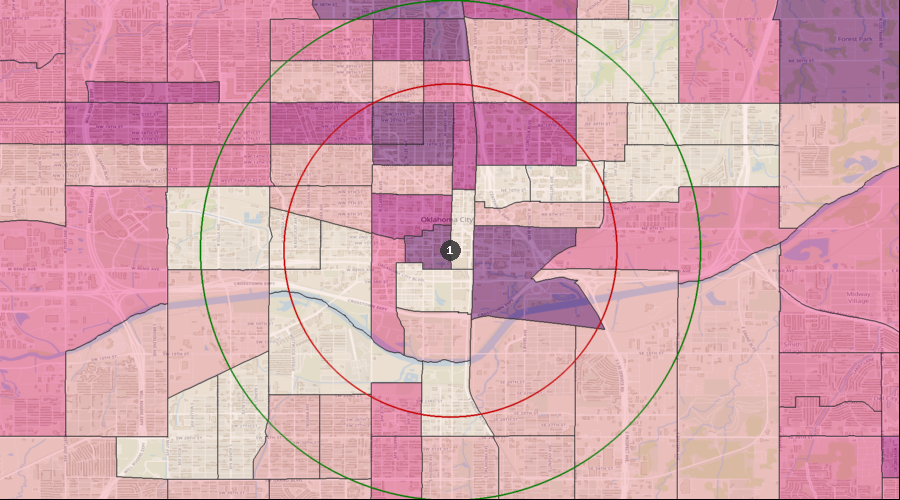
Average Dental Expenditures
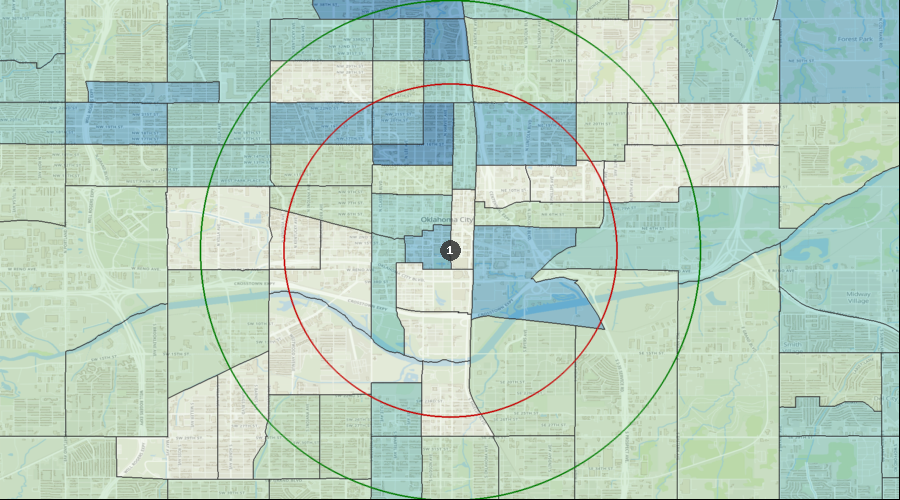
Dental Services per HH (Avg by Census Tract) | $427 to $927 |
| $300 to $427 |
| $206 to $300 |
| $153 to $206 |
| $91 to $153 |
| 1. | Oklahoma City |
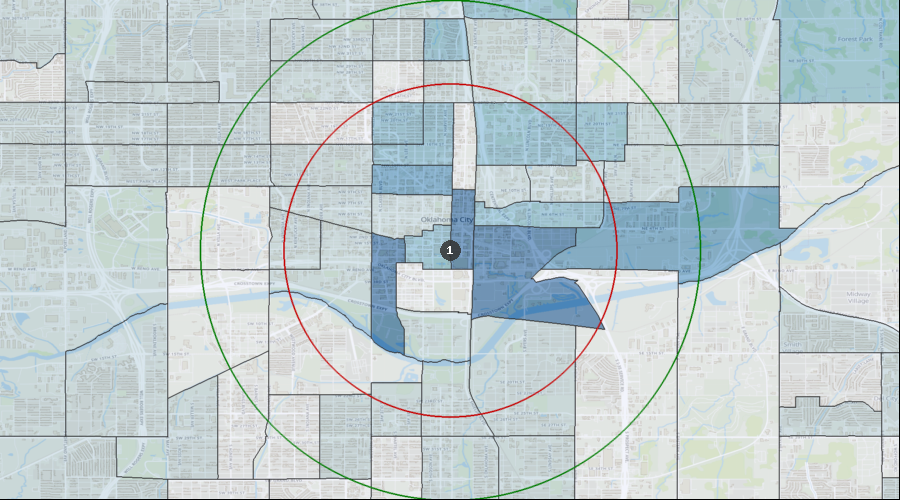
Percentage of the Population Visiting a Dentist in the Last 12 Months
Visited a Dentist in Past 12 Months | 32.76% to 38.75% |
| 27.98% to 32.76% |
| 22.67% to 27.98% |
| 18.57% to 22.67% |
| 15.18% to 18.57% |
| 1. | Oklahoma City |
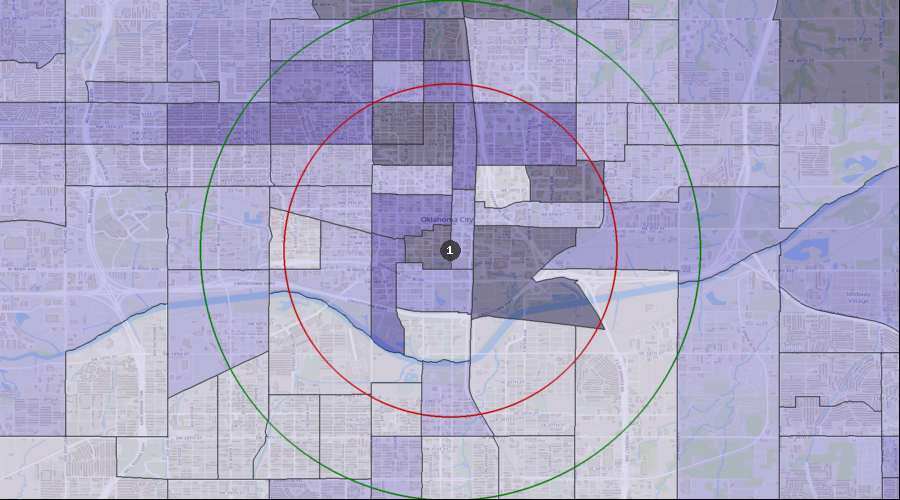
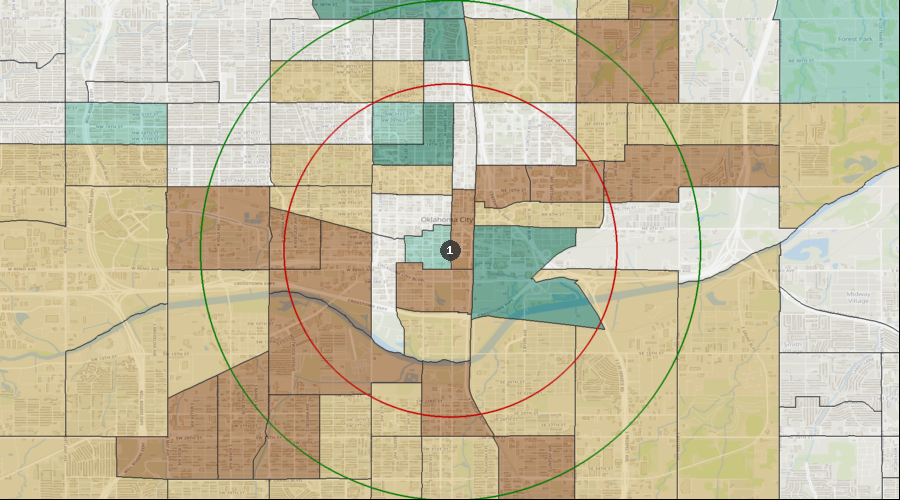
Percentage of the Population with a Bachelor's Degree
Education: Bach Deg by Census Tract | 51.60% to 86.82% |
| 38.96% to 51.60% |
| 26.12% to 38.96% |
| 11.74% to 26.12% |
| 0.00% to 11.74% |
| 1. | Oklahoma City |
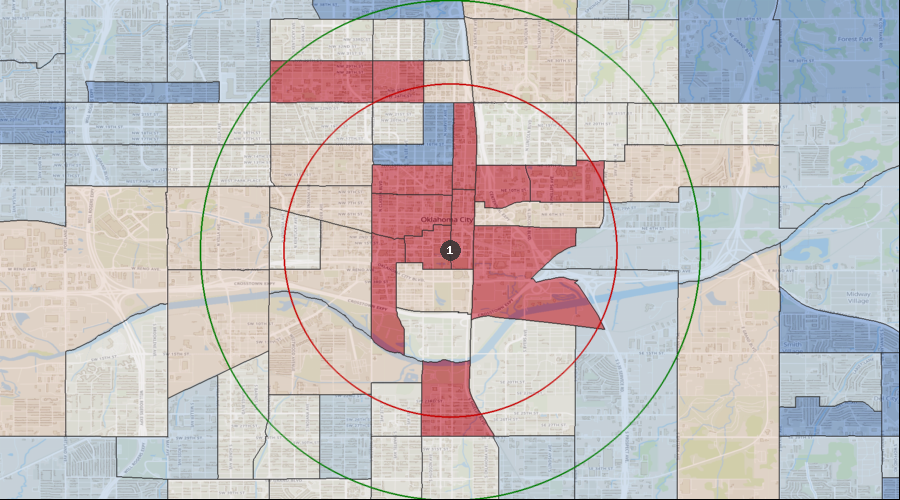
Lifestyle Behaviors – Household Entertainment/Recreation Average Expenditure
Ent/Recreation Per HH (Avg by Census Tract) | $2,840 to $7,551 |
| $2,258 to $2,840 |
| $1,740 to $2,258 |
| $1,306 to $1,740 |
| $716 to $1,306 |
| 1. | Oklahoma City |
Projected Population Growth Rate
Projected Population Growth Per Year | 4.17% to 12.74% |
| 2.35% to 4.17% |
| 1.03% to 2.35% |
| 0.42% to 1.03% |
| -0.28% to 0.42% |
| 1. | Oklahoma City |
Average Household Expenditure for Health Insurance
Health Insurance Avg/HH by Census Tract | $4,358 to $8,449 |
| $3,152 to $4,358 |
| $2,219 to $3,152 |
| $1,614 to $2,219 |
| $870 to $1,614 |
| 1. | Oklahoma City |
Home Ownership Rates
Owner Occupied Households by Census Tract | 54.07% to 85.87% |
| 41.49% to 54.07% |
| 30.59% to 41.49% |
| 15.08% to 30.59% |
| 0.00% to 15.08% |
| 1. | Oklahoma City |
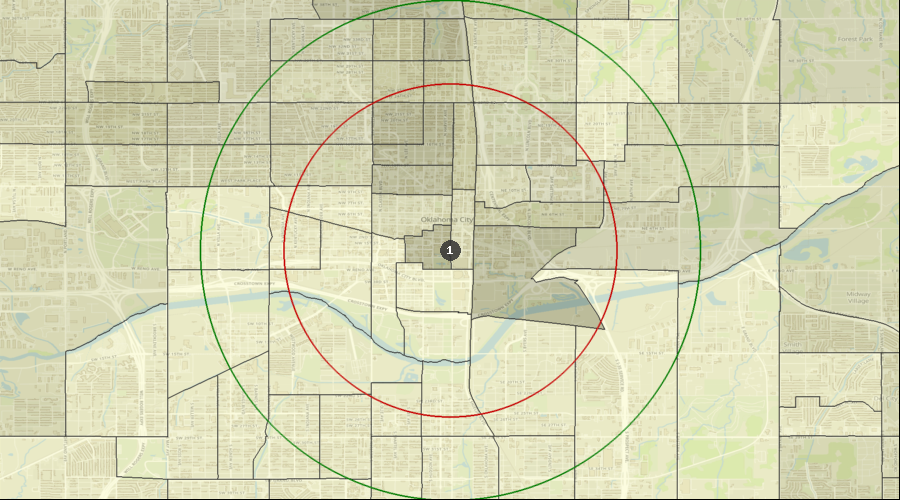
Median Household Income
Median Household Income by Census Tract | $68k to $154k |
| $48k to $68k |
| $35k to $48k |
| $24k to $35k |
| $10k to $24k |
| 1. | Oklahoma City |
Daily Average Traffic Count
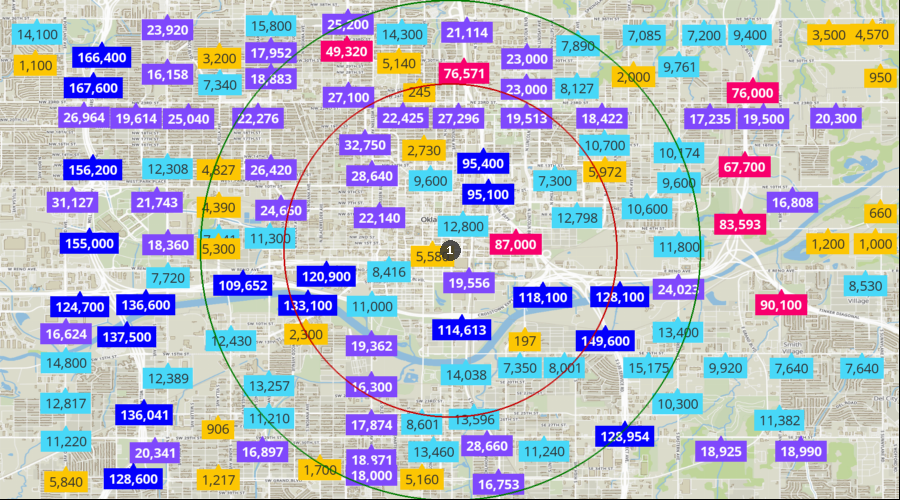
Traffic Counts | 95k to 168k |
| 49k to 95k |
| 16k to 49k |
| 7k to 16k |
| 0k to 7k |
| 1. | Oklahoma City |