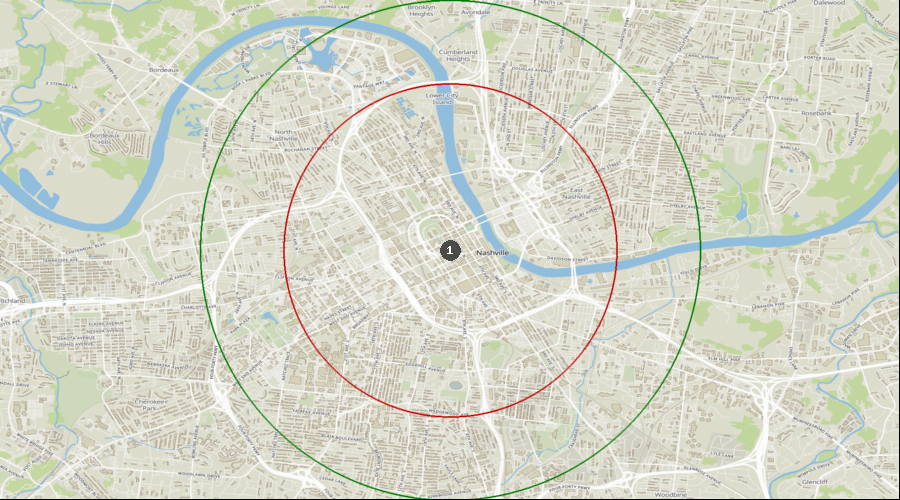
Nashville, Tennessee - Dental Demographics Maps
Want comprehensive data on dentist to population ratios?
A Denali Demographic Study looks at the information in demographic reports like historical data, market saturation, growth drivers, and dental specific statistics, and interprets all these dental demographics to provide a viability ranking that other demographic reports typically don’t provide.
Get a custom study for as little as $159
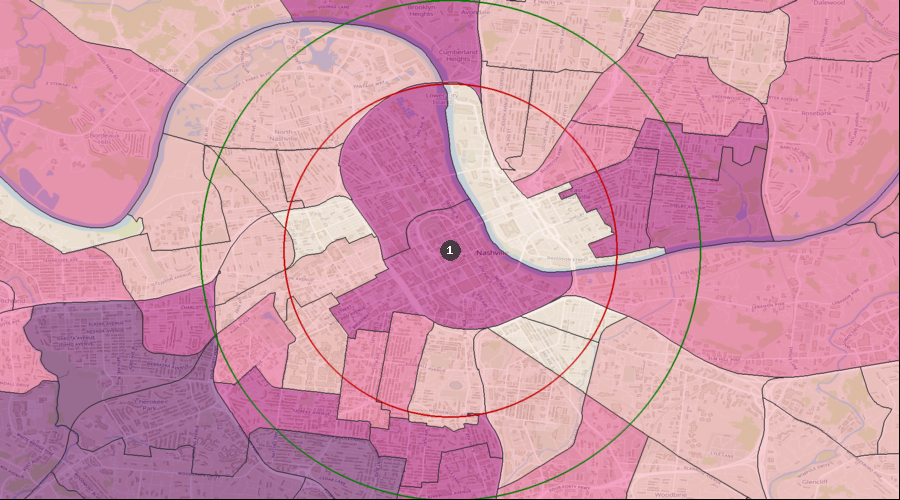
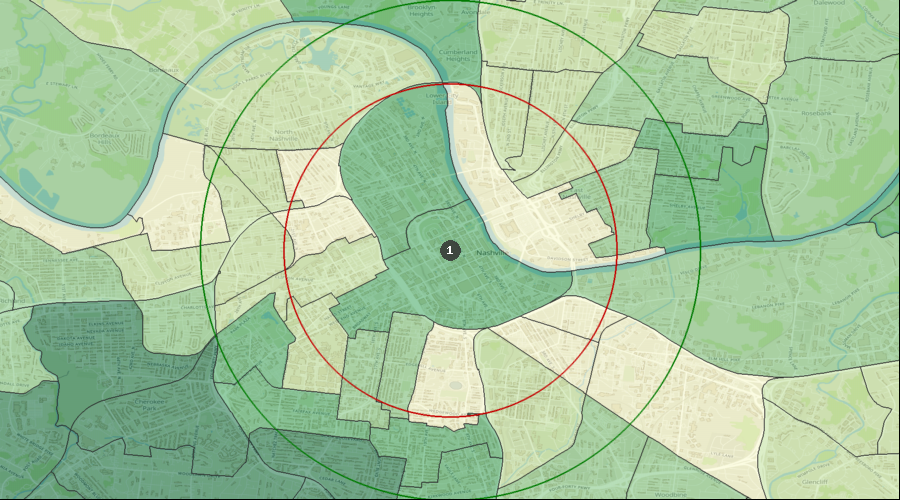
Average Dental Expenditures
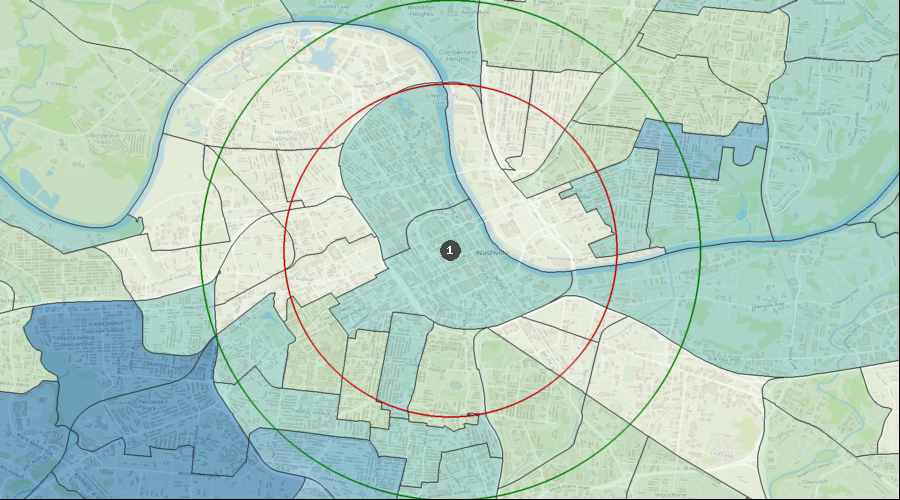
Dental Services per HH (Avg by Census Tract) | $613 to $1,029 |
| $436 to $613 |
| $308 to $436 |
| $189 to $308 |
| $84 to $189 |
| 1. | Nashville |
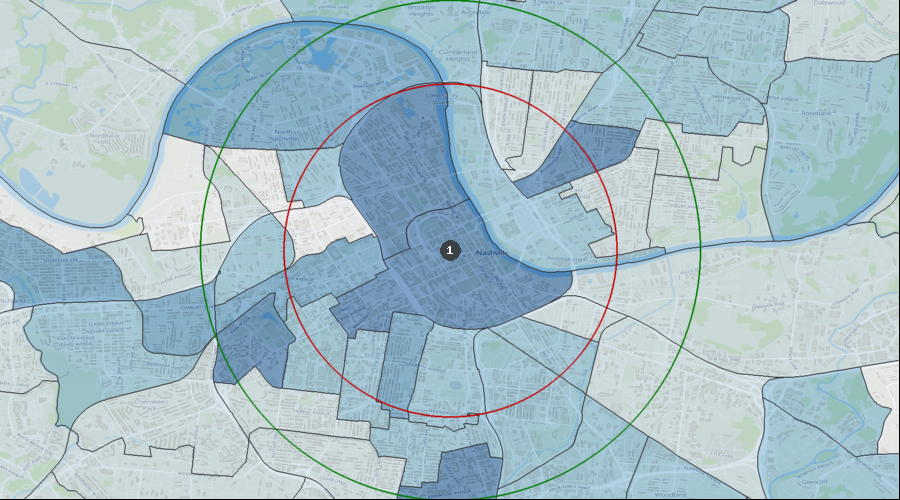
Percentage of the Population Visiting a Dentist in the Last 12 Months
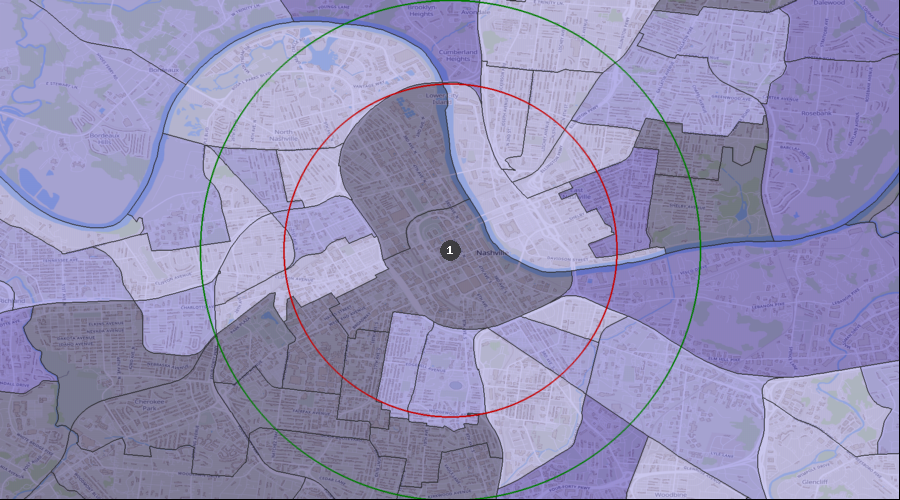
Visited a Dentist in Past 12 Months | 31.85% to 40.18% |
| 26.48% to 31.85% |
| 22.28% to 26.48% |
| 0.00% to 22.28% |
| 1. | Nashville |
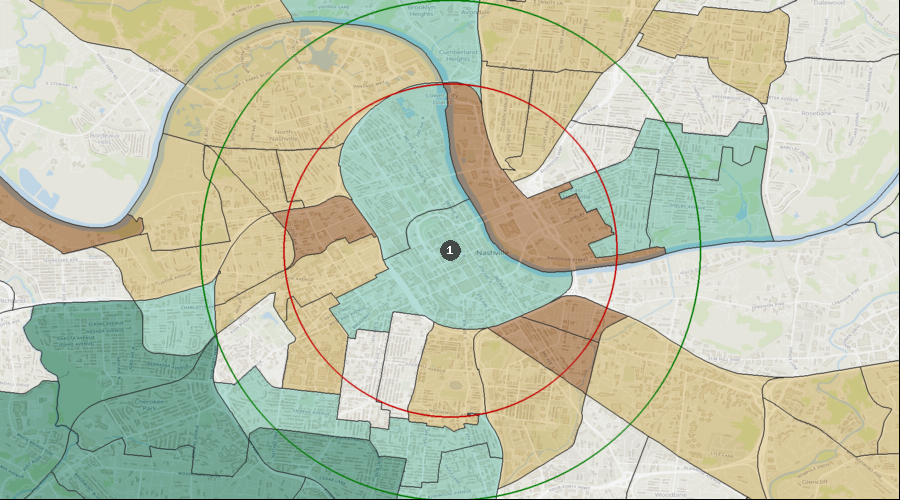
Percentage of the Population with a Bachelor's Degree
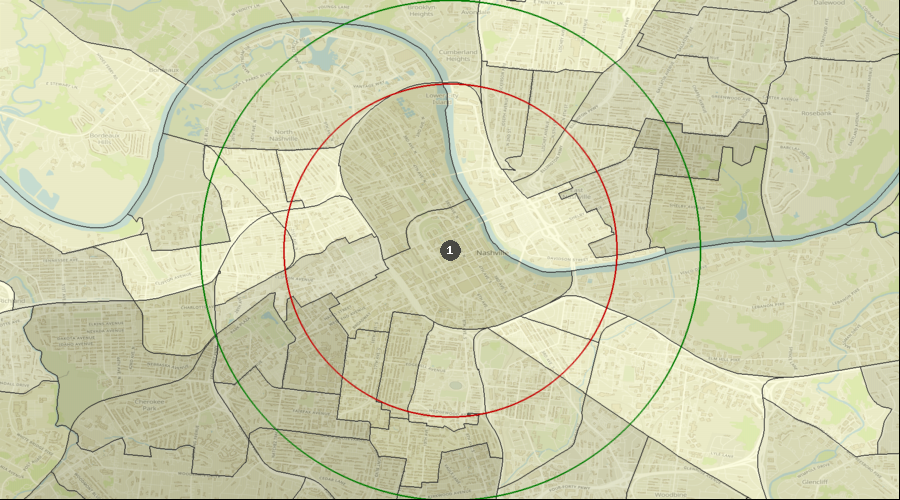
Education: Bach Deg by Census Tract | 67.06% to 81.82% |
| 47.15% to 67.06% |
| 35.22% to 47.15% |
| 22.14% to 35.22% |
| 3.71% to 22.14% |
| 1. | Nashville |
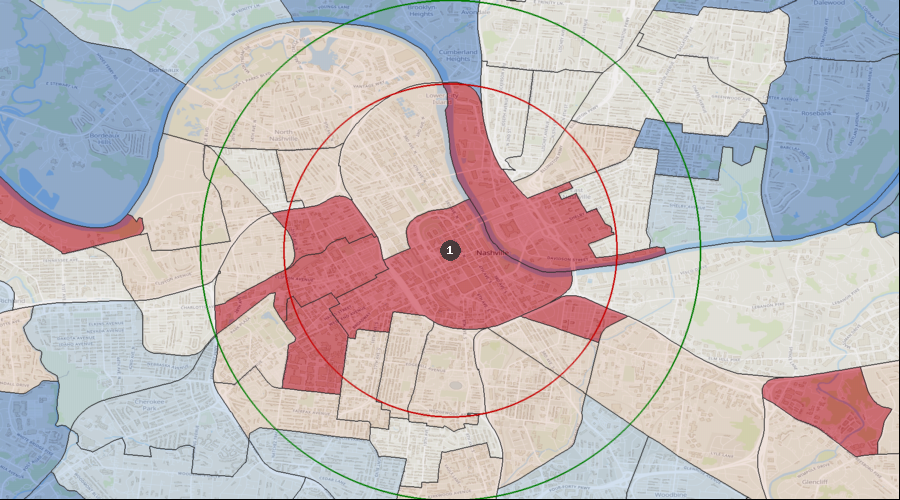
Lifestyle Behaviors – Household Entertainment/Recreation Average Expenditure
Ent/Recreation Per HH (Avg by Census Tract) | $3,975 to $8,260 |
| $2,991 to $3,975 |
| $2,138 to $2,991 |
| $1,231 to $2,138 |
| $0 to $1,231 |
| 1. | Nashville |
Projected Population Growth Rate
Projected Population Growth Per Year | 3.18% to 5.01% |
| 1.99% to 3.18% |
| 1.12% to 1.99% |
| 0.56% to 1.12% |
| 0.00% to 0.56% |
| 1. | Nashville |
Average Household Expenditure for Health Insurance
Health Insurance Avg/HH by Census Tract | $4,713 to $9,364 |
| $3,545 to $4,713 |
| $2,547 to $3,545 |
| $1,500 to $2,547 |
| $0 to $1,500 |
| 1. | Nashville |
Home Ownership Rates
Owner Occupied Households by Census Tract | 62.55% to 84.19% |
| 46.77% to 62.55% |
| 31.70% to 46.77% |
| 14.29% to 31.70% |
| 0.20% to 14.29% |
| 1. | Nashville |
Median Household Income
Median Household Income by Census Tract | $85k to $146k |
| $60k to $85k |
| $44k to $60k |
| $26k to $44k |
| $0k to $26k |
| 1. | Nashville |
Daily Average Traffic Count
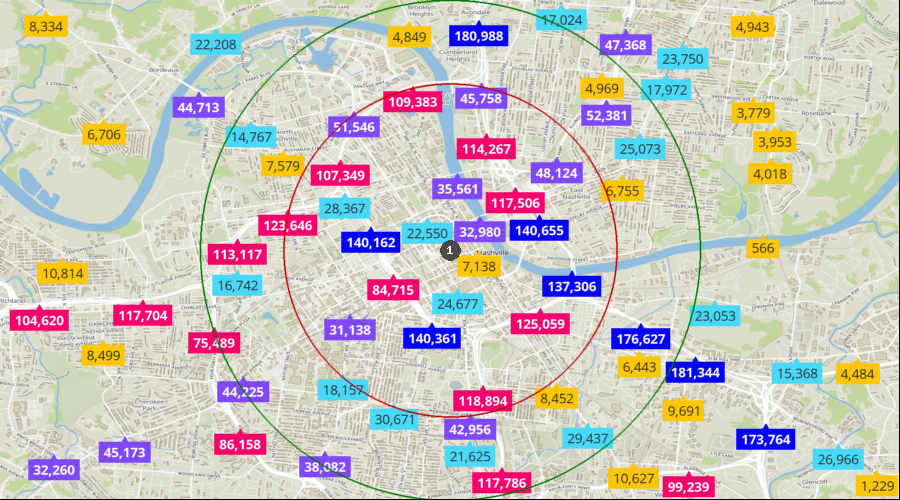
Traffic Counts | 127k to 181k |
| 55k to 127k |
| 31k to 55k |
| 14k to 31k |
| 0k to 14k |
| 1. | Nashville |