![]() | Housing |
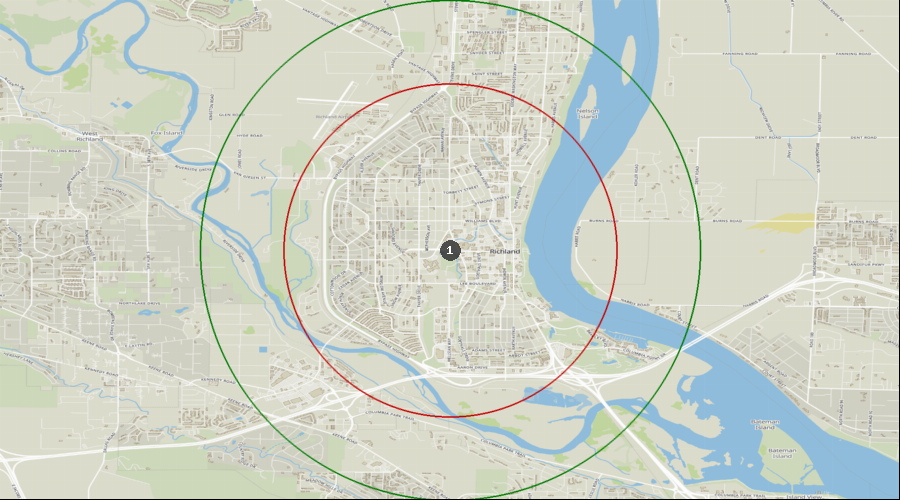
This 2 mile radius contains 12,792 housing units and a vacancy rate of 5.8%. This area has a 51.3% home ownership rate and 42.9% of the population are renters. The ownership occupancy levels are below Washington and US.
| Home values have two implications—they can signal the relative affluence of an area and thus the ability of its population to spend more on dental care, but they can also show the relative unaffordability of an area and its possibility not to grow as fast as other more affordable locations. The median home ownership value in this area is $423,018 which is well below Washington. The median home ownership value for the United States is $303,400. This area averages spending 32.7% of their income on total housing which is considerably higher than the 30% figure that is considered a healthy housing spending percentage. Total housing expenditure includes the cost of shelter as well as utilities, fuel, and public services like water and sewer. This means that housing expenditures use a greater amount of the household budget on a national basis than it should by large amount. Disposable income in this area averages 67.3%. The average housing cost of just shelter as a percent of income in this area at 23.2%. The area is affordable for those living here. In general, all these housing factors are below average indicators of desirability of an area and its economic growth potential. |  |
|  | Table #2 Significant Demographic Characteristics - Page 2 |
| |
Demographic Analysis for Richland, Washington
|
|
|
|
|
| HOUSING | | | | |
| Housing units | 12,792 | 19,450 | 3,340,362 | 145,184,826 |
| Median home value | $423,018 | $458,458 | $632,296 | $355,577 |
| Home ownership rate | 51.3% | 58.5% | 59.6% | 57.9% |
| Renter-occupied housing | 42.9% | 36.1% | 33.4% | 32.1% |
| Vacant housing units | 5.8% | 5.4% | 7.0% | 10.0% |
| Average Cost of Housing | $22,253 | $26,459 | $32,503 | $26,595 |
| Average Housing Cost as a Percent of Income | 23.2% | 23.0% | 23.9% | 23.5% |
| HOUSEHOLDS | | | | |
| Households | 12,044 | 18,397 | 3,107,079 | 130,716,571 |
| Average household size | 2.45 | 2.53 | 2.53 | 2.53 |
| Family households | 57.9% | 62.6% | 62.4% | 64.0% |
| Household with children | 31.8% | 32.1% | 31.9% | 33.4% |
| High school graduate or higher | 95.5% | 96.2% | 92.8% | 90.6% |
| Bachelor degree or higher | 35.6% | 41.8% | 40.5% | 36.8% |
| RACE & ETHNICITY | | | | |
| White | 73.4% | 73.7% | 64.4% | 60.3% |
| Black | 2.0% | 1.8% | 4.1% | 12.5% |
| Native American | 1.0% | 0.9% | 1.6% | 1.1% |
| Asian | 2.8% | 3.8% | 10.5% | 6.4% |
| Pacific Islanders | 0.3% | 0.3% | 0.9% | 0.2% |
| Other Race | 8.5% | 8.0% | 7.1% | 8.8% |
| Hispanic or Latino of any race | 19.8% | 18.4% | 14.7% | 19.6% |