Richland, Washington - Dental Demographics Maps
Want comprehensive data on dentist to population ratios?
A Denali Demographic Study looks at the information in demographic reports like historical data, market saturation, growth drivers, and dental specific statistics, and interprets all these dental demographics to provide a viability ranking that other demographic reports typically don’t provide.
Get a custom study for as little as $159
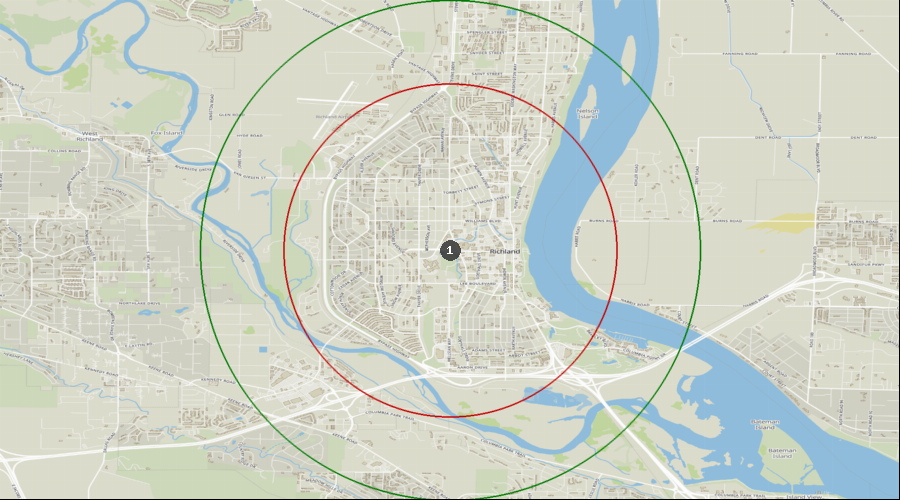
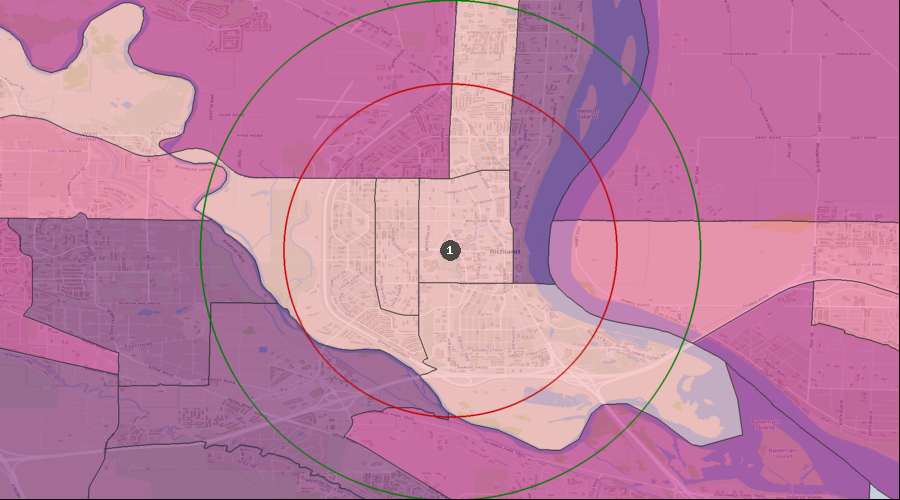
Average Dental Expenditures
Dental Services per HH (Avg by Census Tract) | $558 to $753 |
| $447 to $558 |
| $335 to $447 |
| $277 to $335 |
| $233 to $277 |
| 1. | Richland |
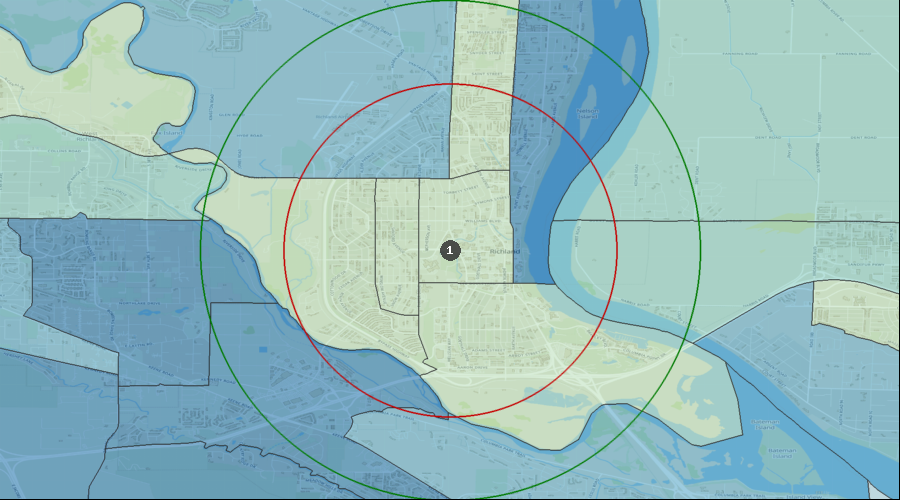
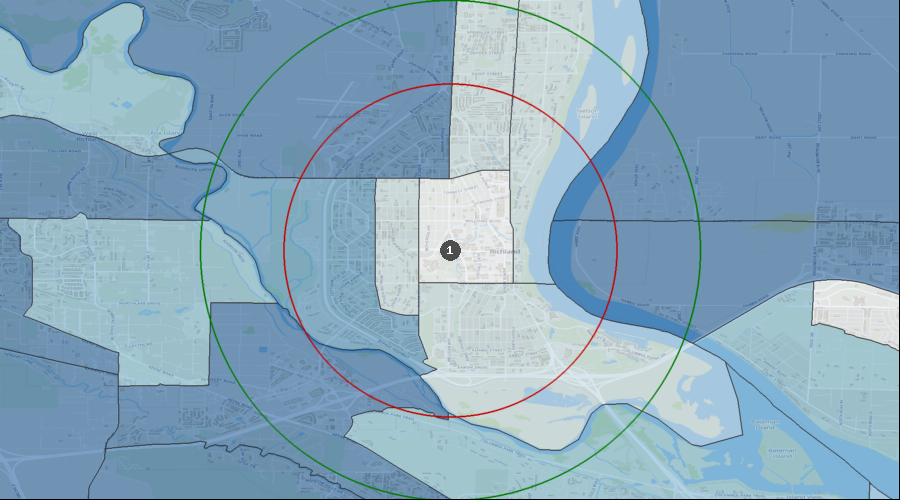
Percentage of the Population Visiting a Dentist in the Last 12 Months
Visited a Dentist in Past 12 Months | 34.20% to 40.18% |
| 29.56% to 34.20% |
| 25.18% to 29.56% |
| 21.23% to 25.18% |
| 20.16% to 21.23% |
| 1. | Richland |
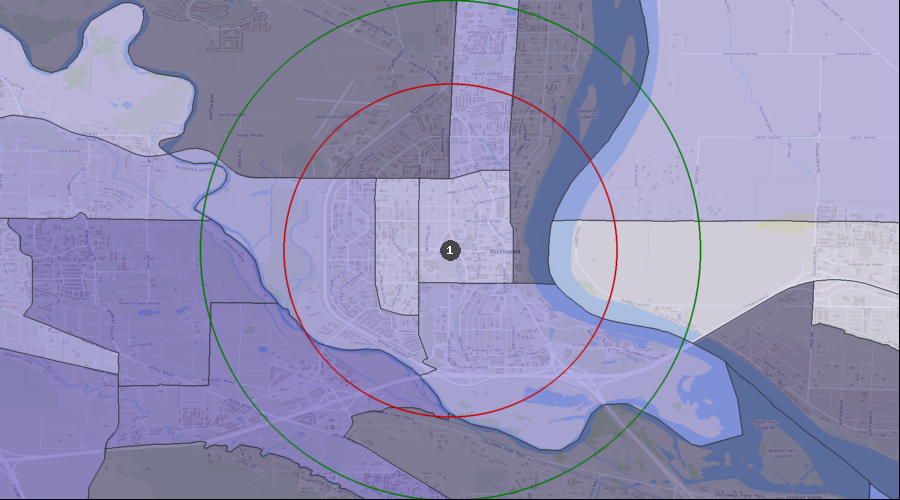
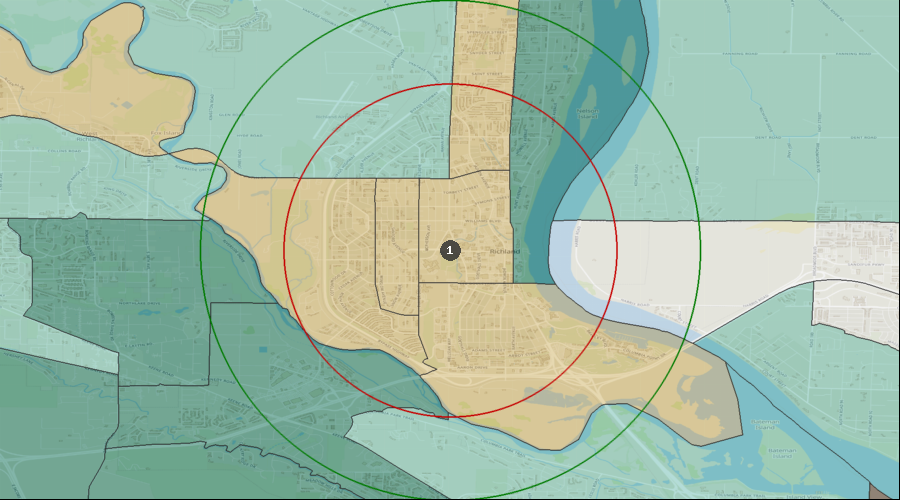
Percentage of the Population with a Bachelor's Degree
Education: Bach Deg by Census Tract | 49.24% to 65.44% |
| 38.68% to 49.24% |
| 29.24% to 38.68% |
| 19.98% to 29.24% |
| 15.95% to 19.98% |
| 1. | Richland |
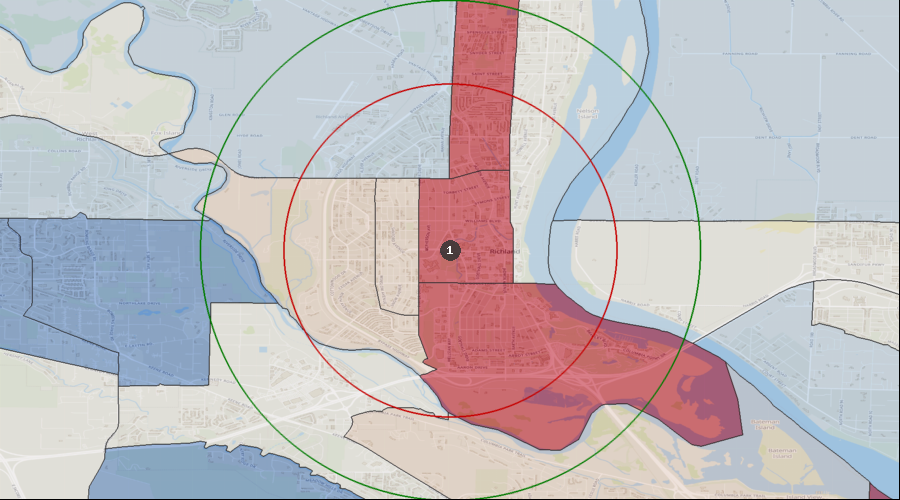
Lifestyle Behaviors – Household Entertainment/Recreation Average Expenditure
Ent/Recreation Per HH (Avg by Census Tract) | $4,498 to $6,156 |
| $3,415 to $4,498 |
| $2,848 to $3,415 |
| $2,158 to $2,848 |
| $2,095 to $2,158 |
| 1. | Richland |
Projected Population Growth Rate
Projected Population Growth Per Year | 2.21% to 2.96% |
| 1.83% to 2.21% |
| 1.23% to 1.83% |
| 0.77% to 1.23% |
| 0.53% to 0.77% |
| 1. | Richland |
Average Household Expenditure for Health Insurance
Health Insurance Avg/HH by Census Tract | $5,574 to $7,186 |
| $4,249 to $5,574 |
| $3,348 to $4,249 |
| $2,623 to $3,348 |
| $2,476 to $2,623 |
| 1. | Richland |
Home Ownership Rates
Owner Occupied Households by Census Tract | 82.04% to 92.81% |
| 74.57% to 82.04% |
| 62.41% to 74.57% |
| 38.69% to 62.41% |
| 31.41% to 38.69% |
| 1. | Richland |
Median Household Income
Median Household Income by Census Tract | $89k to $138k |
| $80k to $89k |
| $64k to $80k |
| $53k to $64k |
| $48k to $53k |
| 1. | Richland |
Daily Average Traffic Count
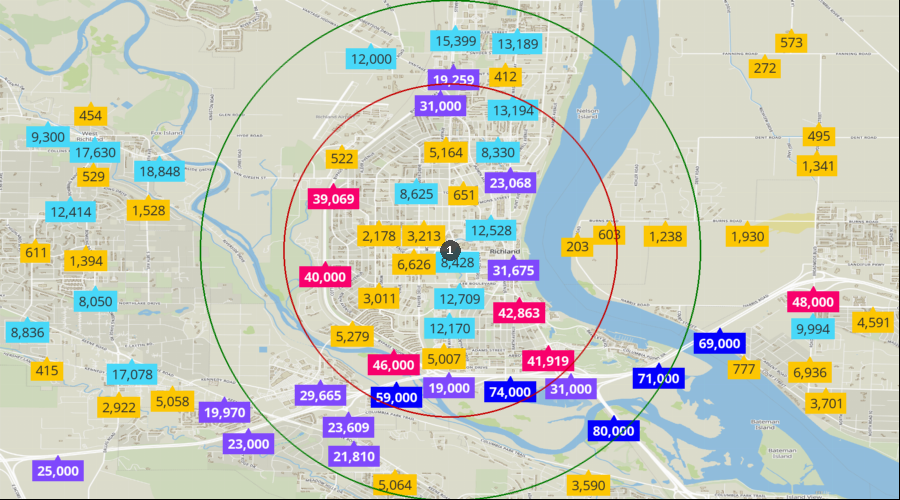
Traffic Counts | 51k to 80k |
| 33k to 51k |
| 19k to 33k |
| 7k to 19k |
| 0k to 7k |
| 1. | Richland |