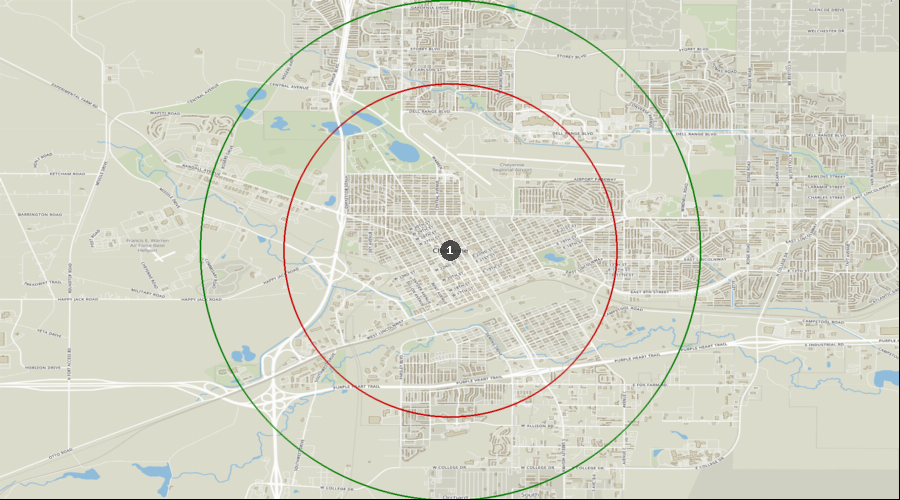
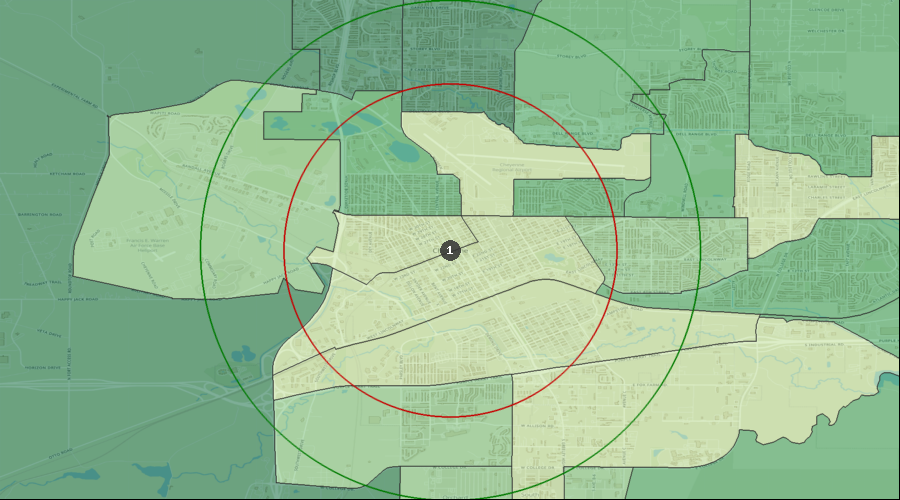
Cheyenne, Wyoming - Dental Demographics Maps
Want comprehensive data on dentist to population ratios?
A Denali Demographic Study looks at the information in demographic reports like historical data, market saturation, growth drivers, and dental specific statistics, and interprets all these dental demographics to provide a viability ranking that other demographic reports typically don’t provide.
Get a custom study for as little as $159
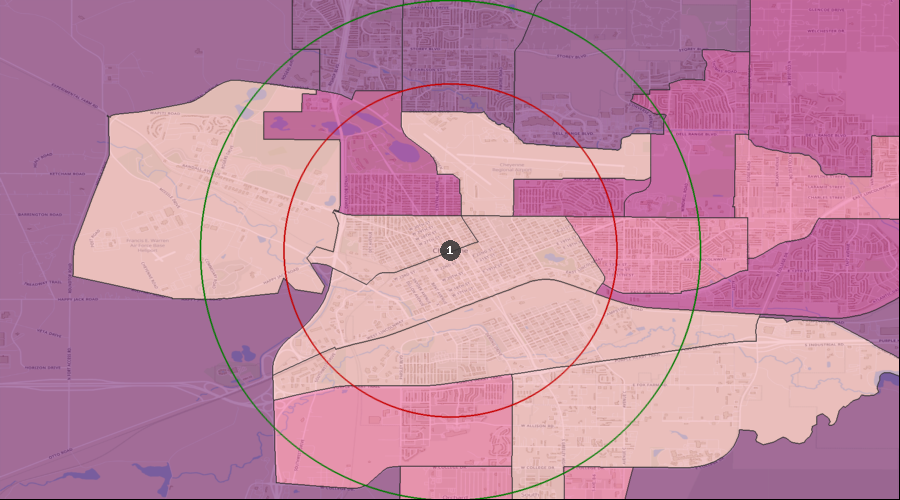
Average Dental Expenditures
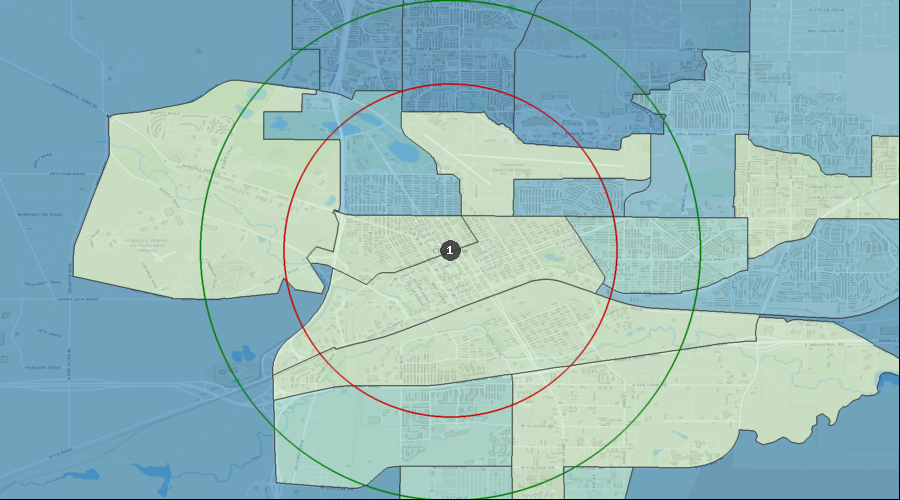
Dental Services per HH (Avg by Census Tract) | $386 to $475 |
| $332 to $386 |
| $266 to $332 |
| $0 to $266 |
| 1. | Cheyenne |
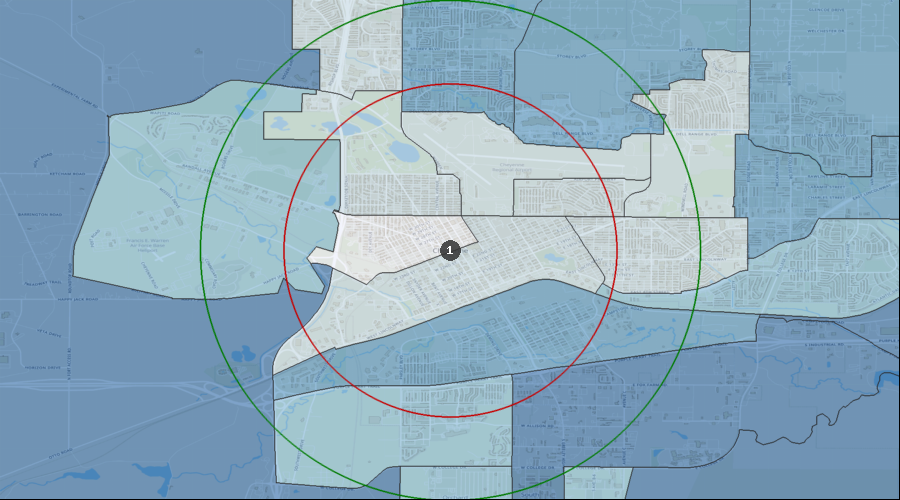
Percentage of the Population Visiting a Dentist in the Last 12 Months
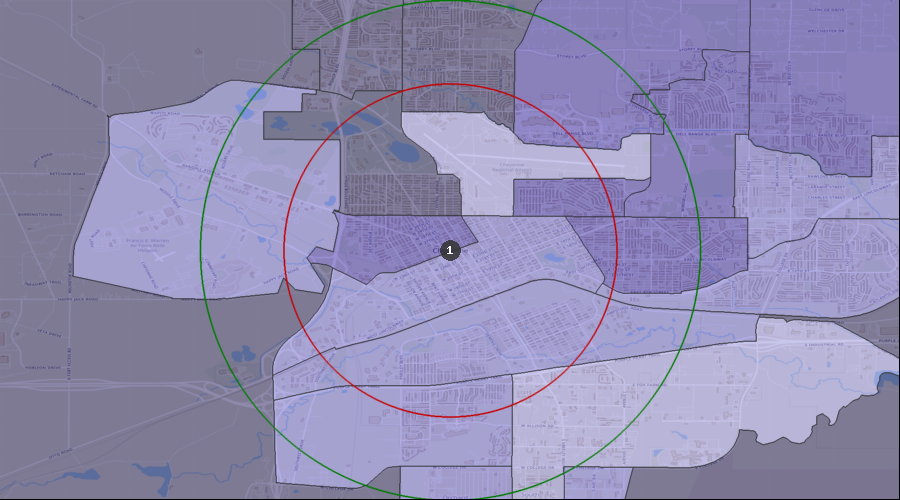
Visited a Dentist in Past 12 Months | 32.48% to 37.94% |
| 25.87% to 32.48% |
| 19.67% to 25.87% |
| 0.00% to 19.67% |
| 1. | Cheyenne |
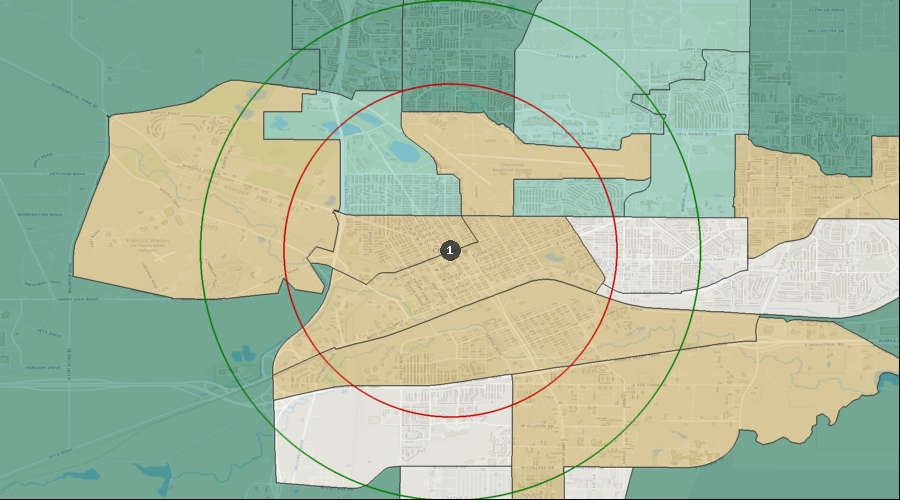
Percentage of the Population with a Bachelor's Degree
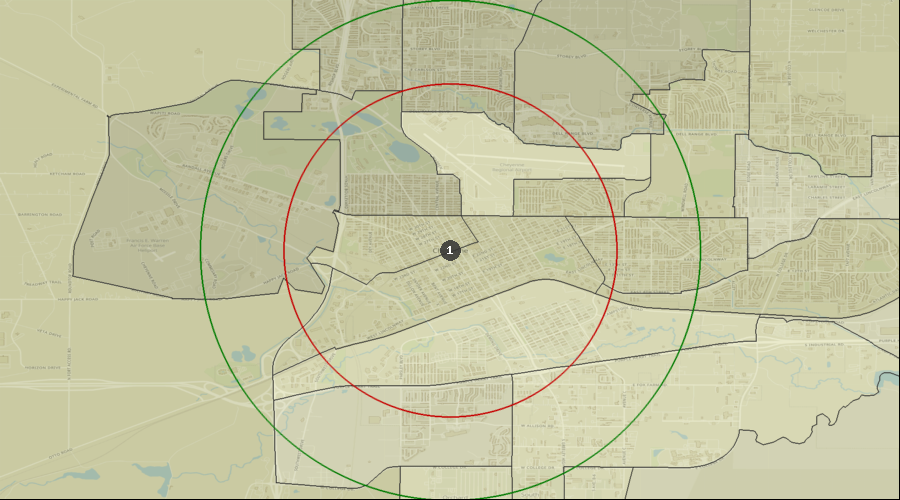
Education: Bach Deg by Census Tract | 35.41% to 57.28% |
| 23.33% to 35.41% |
| 15.40% to 23.33% |
| 0.00% to 15.40% |
| 1. | Cheyenne |
Lifestyle Behaviors – Household Entertainment/Recreation Average Expenditure
Ent/Recreation Per HH (Avg by Census Tract) | $3,163 to $3,668 |
| $2,584 to $3,163 |
| $2,056 to $2,584 |
| $0 to $2,056 |
| 1. | Cheyenne |
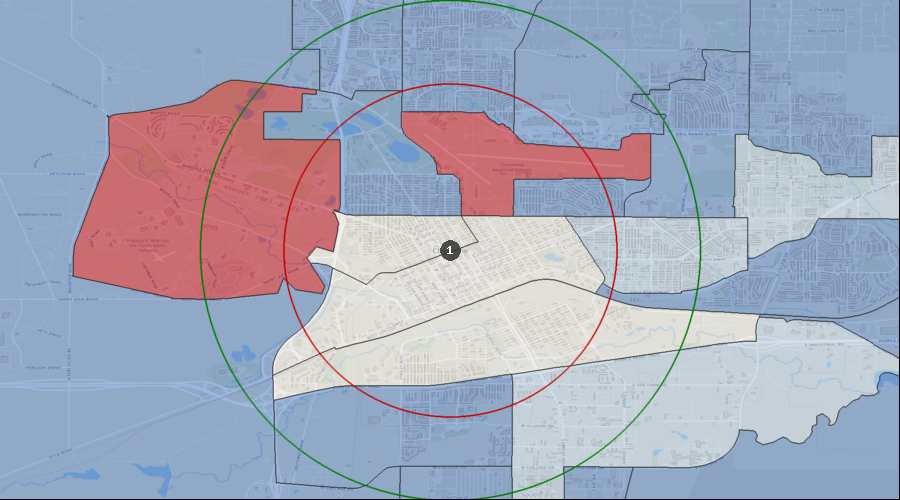
Projected Population Growth Rate
Projected Population Growth Per Year | 1.05% to 1.61% |
| 0.78% to 1.05% |
| 0.44% to 0.78% |
| 0.00% to 0.44% |
| -0.16% to 0.00% |
| 1. | Cheyenne |
Average Household Expenditure for Health Insurance
Health Insurance Avg/HH by Census Tract | $3,873 to $4,459 |
| $3,327 to $3,873 |
| $2,503 to $3,327 |
| $0 to $2,503 |
| 1. | Cheyenne |
Home Ownership Rates
Owner Occupied Households by Census Tract | 62.98% to 81.35% |
| 53.02% to 62.98% |
| 38.25% to 53.02% |
| 1.82% to 38.25% |
| 0.00% to 1.82% |
| 1. | Cheyenne |
Median Household Income
Median Household Income by Census Tract | $75k to $86k |
| $60k to $75k |
| $44k to $60k |
| $0k to $44k |
| 1. | Cheyenne |
Daily Average Traffic Count
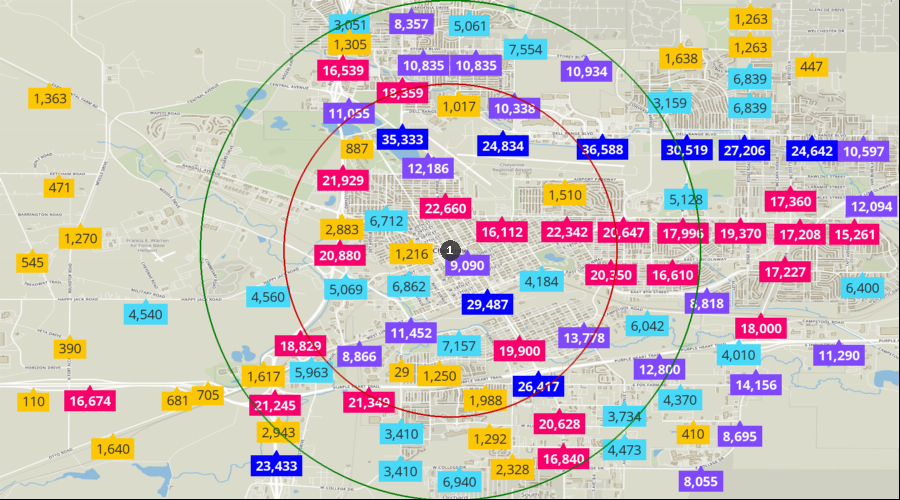
Traffic Counts | 23k to 37k |
| 15k to 23k |
| 8k to 15k |
| 3k to 8k |
| 0k to 3k |
| 1. | Cheyenne |