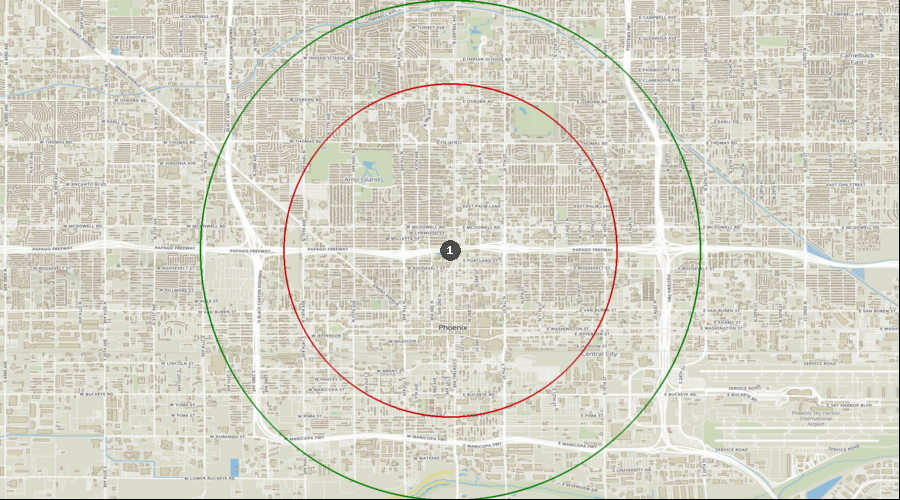
Phoenix, Arizona - Dental Demographics Maps
Want comprehensive data on dentist to population ratios?
A Denali Demographic Study looks at the information in demographic reports like historical data, market saturation, growth drivers, and dental specific statistics, and interprets all these dental demographics to provide a viability ranking that other demographic reports typically don’t provide.
Get a custom study for as little as $159
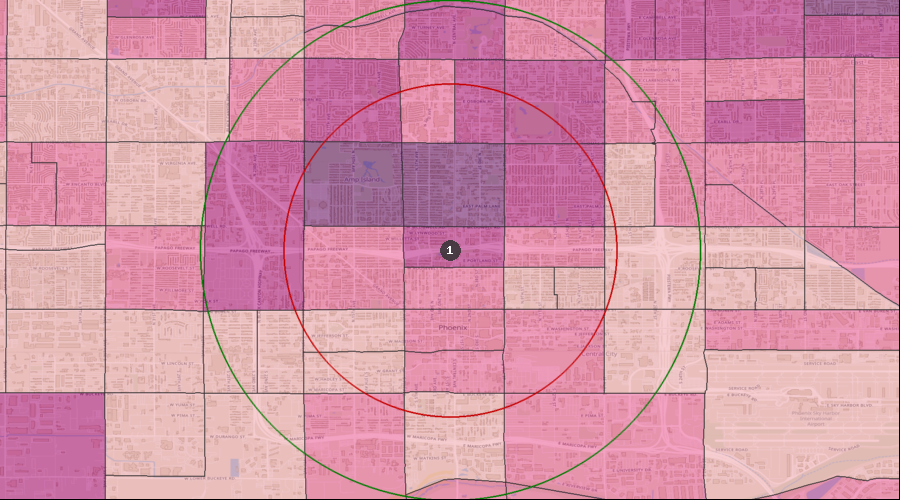
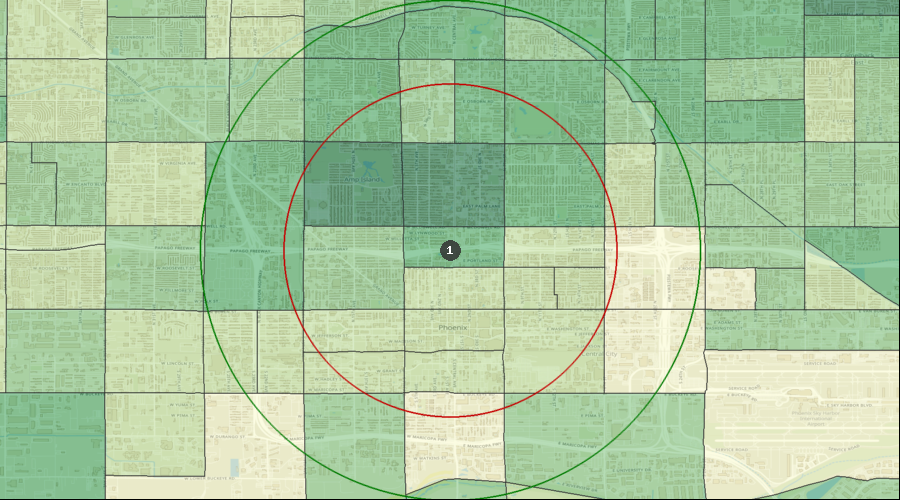
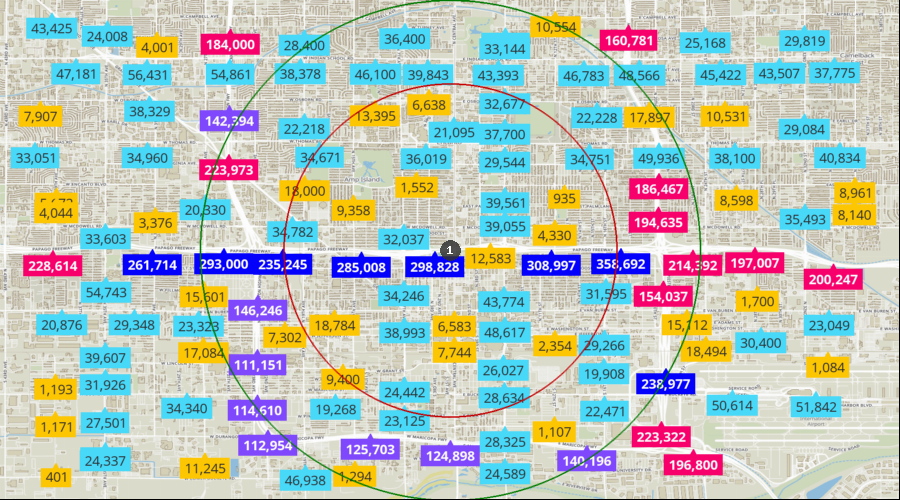
Average Dental Expenditures
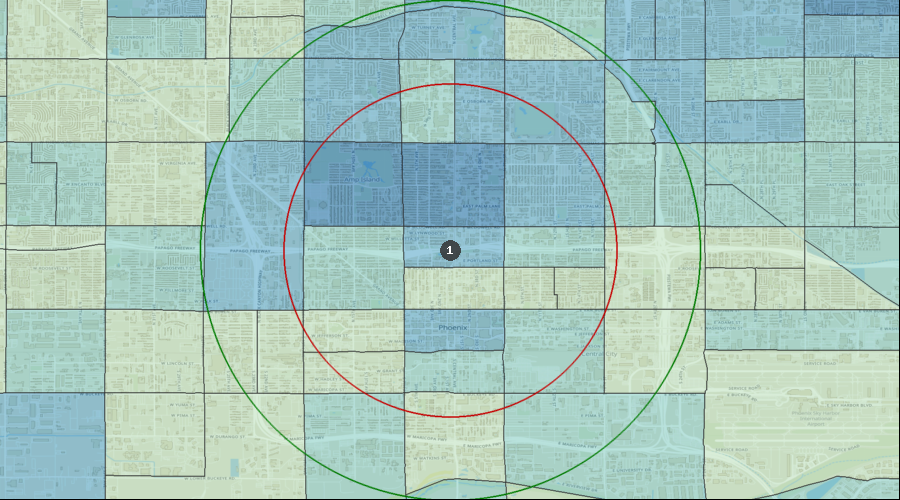
Dental Services per HH (Avg by Census Tract) | $416 to $667 |
| $272 to $416 |
| $185 to $272 |
| $0 to $185 |
| 1. | Phoenix |
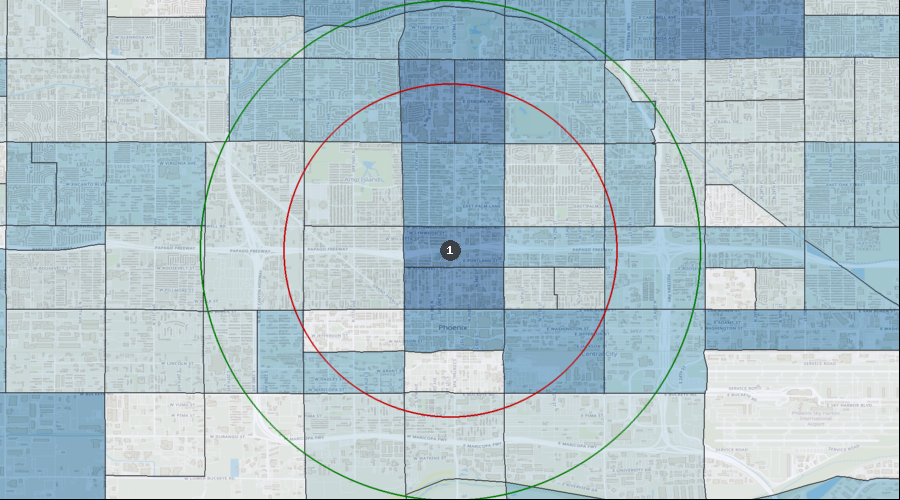
Percentage of the Population Visiting a Dentist in the Last 12 Months
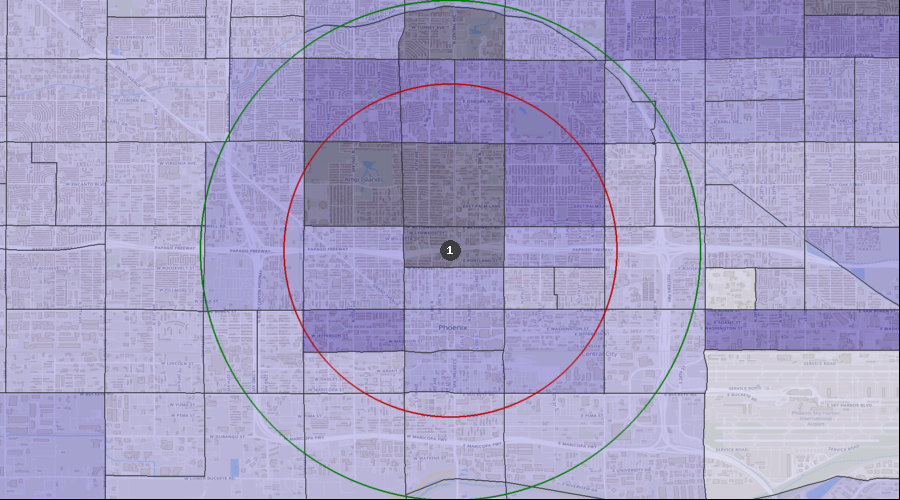
Visited a Dentist in Past 12 Months | 32.03% to 38.40% |
| 25.73% to 32.03% |
| 20.18% to 25.73% |
| 4.52% to 20.18% |
| 0.00% to 4.52% |
| 1. | Phoenix |
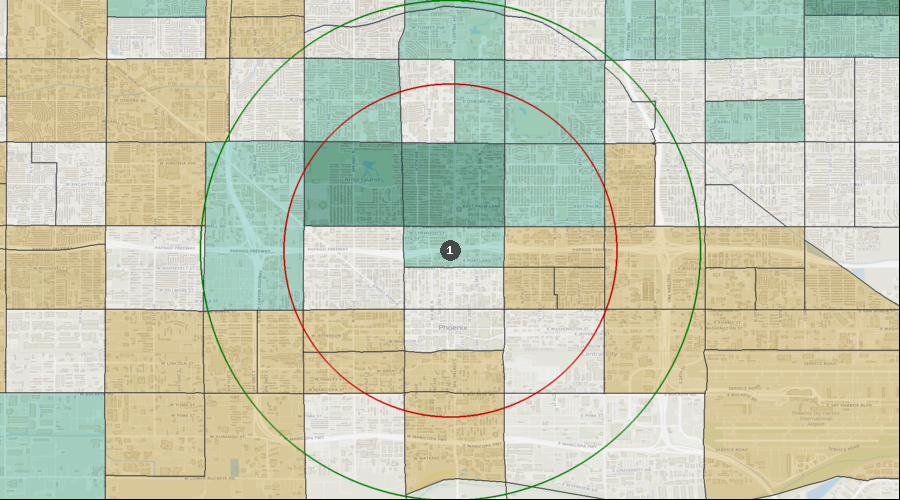
Percentage of the Population with a Bachelor's Degree
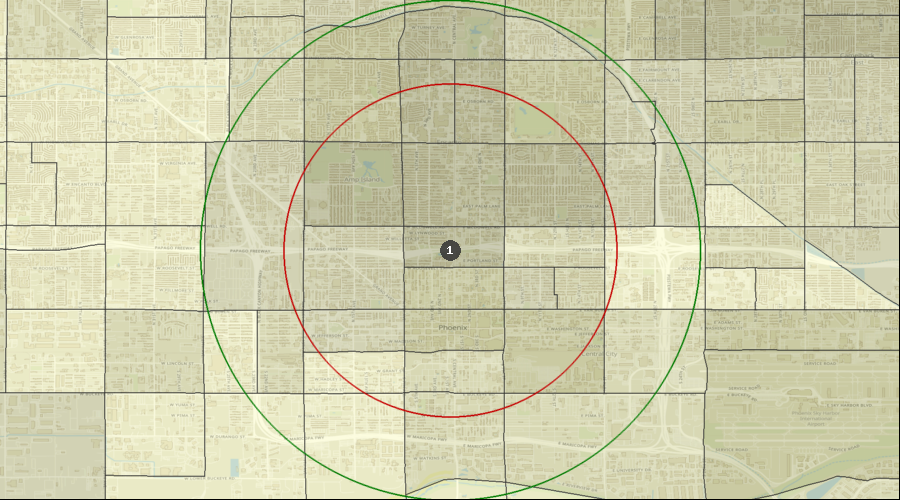
Education: Bach Deg by Census Tract | 42.49% to 61.78% |
| 29.20% to 42.49% |
| 16.89% to 29.20% |
| 7.47% to 16.89% |
| 0.56% to 7.47% |
| 1. | Phoenix |
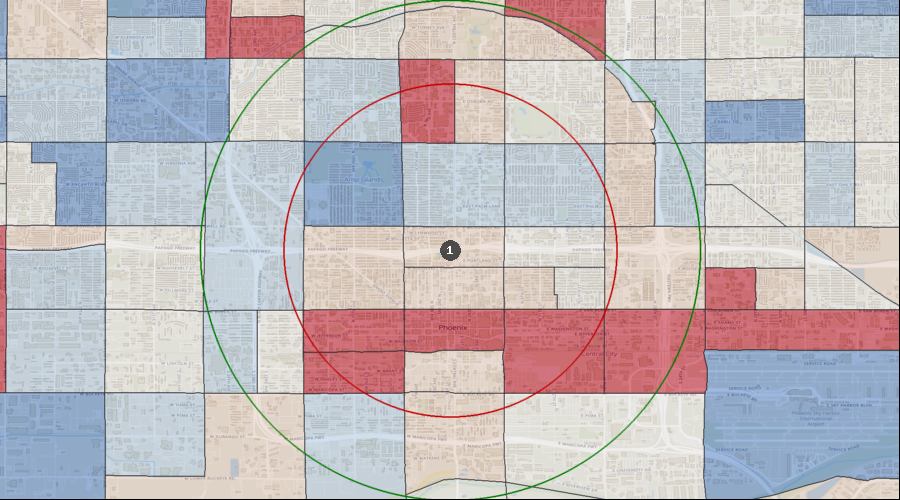
Lifestyle Behaviors – Household Entertainment/Recreation Average Expenditure
Ent/Recreation Per HH (Avg by Census Tract) | $3,463 to $5,506 |
| $2,297 to $3,463 |
| $1,562 to $2,297 |
| $0 to $1,562 |
| 1. | Phoenix |
Projected Population Growth Rate
Projected Population Growth Per Year | 3.16% to 7.87% |
| 1.98% to 3.16% |
| 1.18% to 1.98% |
| 0.50% to 1.18% |
| -0.11% to 0.50% |
| 1. | Phoenix |
Average Household Expenditure for Health Insurance
Health Insurance Avg/HH by Census Tract | $4,138 to $6,250 |
| $2,736 to $4,138 |
| $1,878 to $2,736 |
| $0 to $1,878 |
| 1. | Phoenix |
Home Ownership Rates
Owner Occupied Households by Census Tract | 54.13% to 75.00% |
| 40.11% to 54.13% |
| 26.47% to 40.11% |
| 15.21% to 26.47% |
| 0.00% to 15.21% |
| 1. | Phoenix |
Median Household Income
Median Household Income by Census Tract | $69k to $103k |
| $45k to $69k |
| $32k to $45k |
| $17k to $32k |
| $0k to $17k |
| 1. | Phoenix |
Daily Average Traffic Count
Traffic Counts | 229k to 359k |
| 154k to 229k |
| 60k to 154k |
| 19k to 60k |
| 0k to 19k |
| 1. | Phoenix |