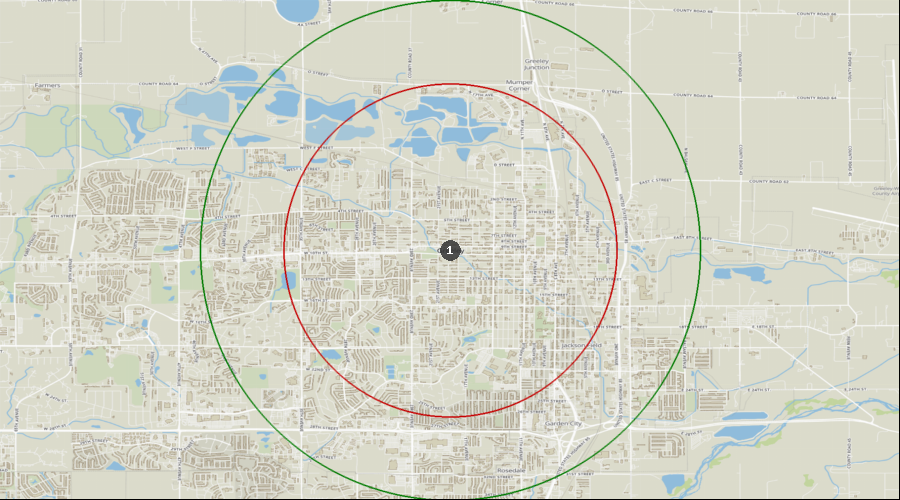
Greeley, Colorado - Dental Demographics Maps
Want comprehensive data on dentist to population ratios?
A Denali Demographic Study looks at the information in demographic reports like historical data, market saturation, growth drivers, and dental specific statistics, and interprets all these dental demographics to provide a viability ranking that other demographic reports typically don’t provide.
Get a custom study for as little as $159
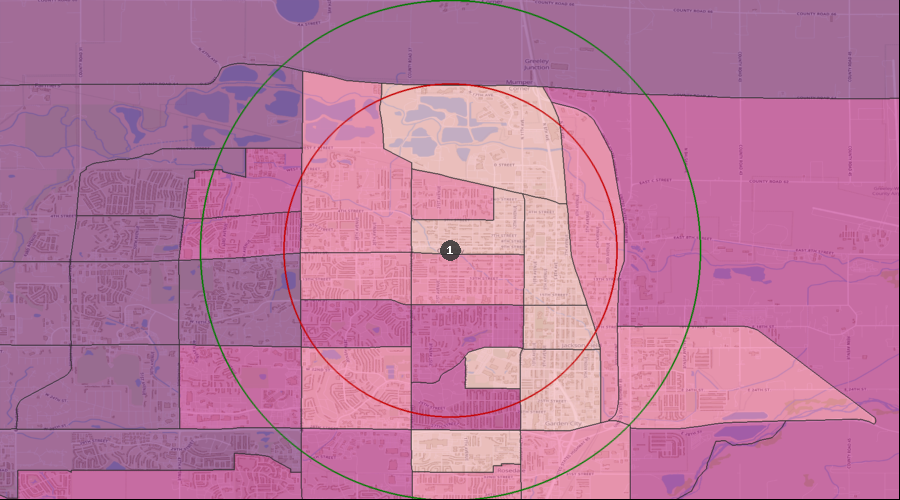
Average Dental Expenditures
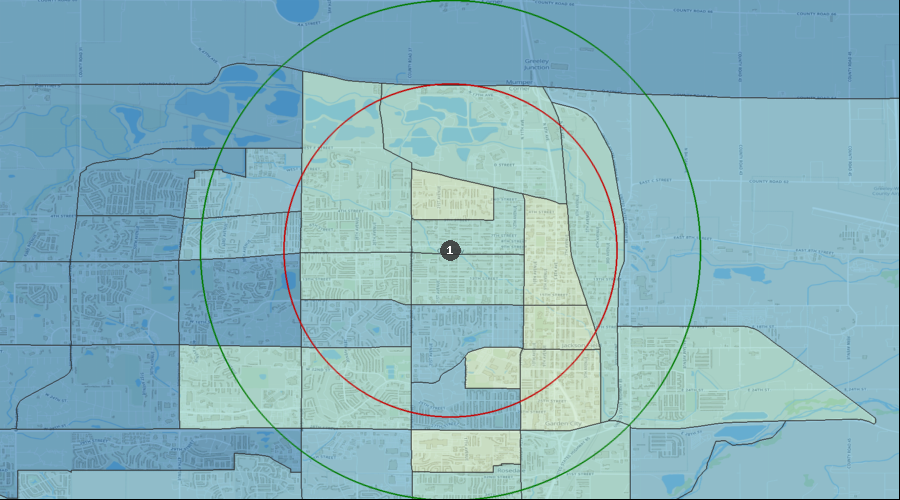
Dental Services per HH (Avg by Census Tract) | $391 to $623 |
| $305 to $391 |
| $204 to $305 |
| $0 to $204 |
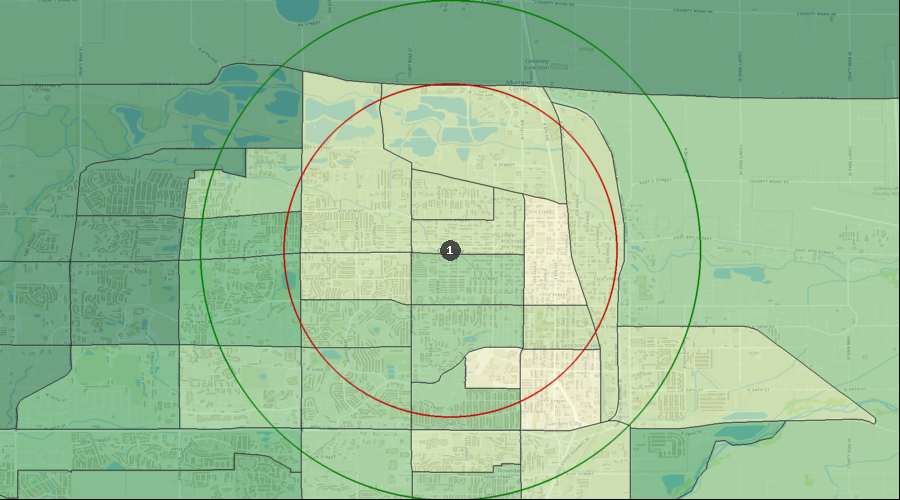
| 1. | Greeley |
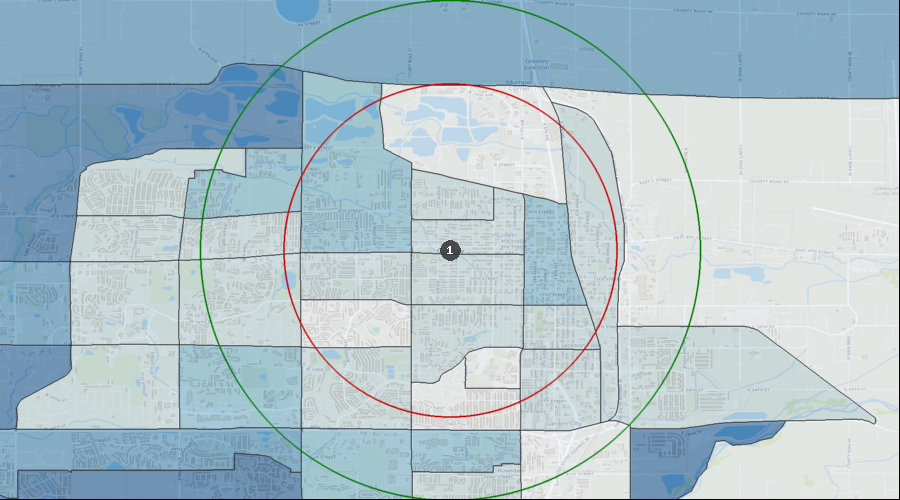
Percentage of the Population Visiting a Dentist in the Last 12 Months
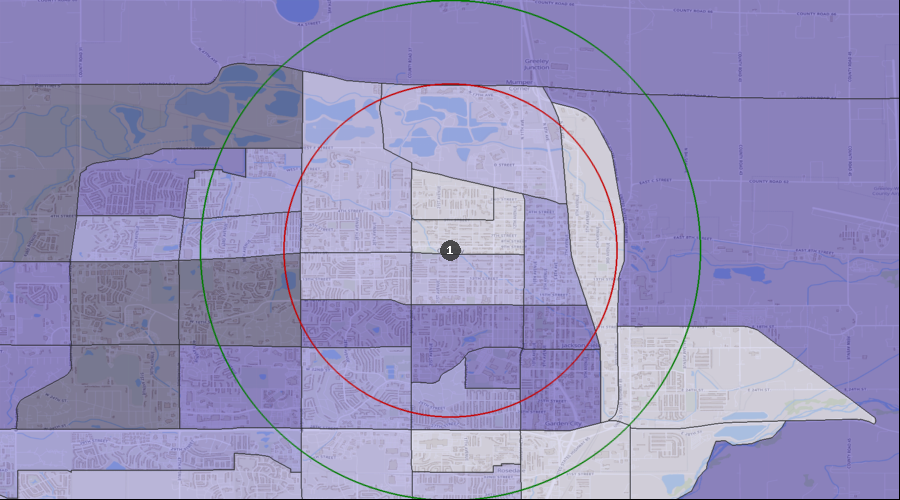
Visited a Dentist in Past 12 Months | 34.64% to 44.44% |
| 28.44% to 34.64% |
| 23.93% to 28.44% |
| 20.51% to 23.93% |
| 16.75% to 20.51% |
| 1. | Greeley |
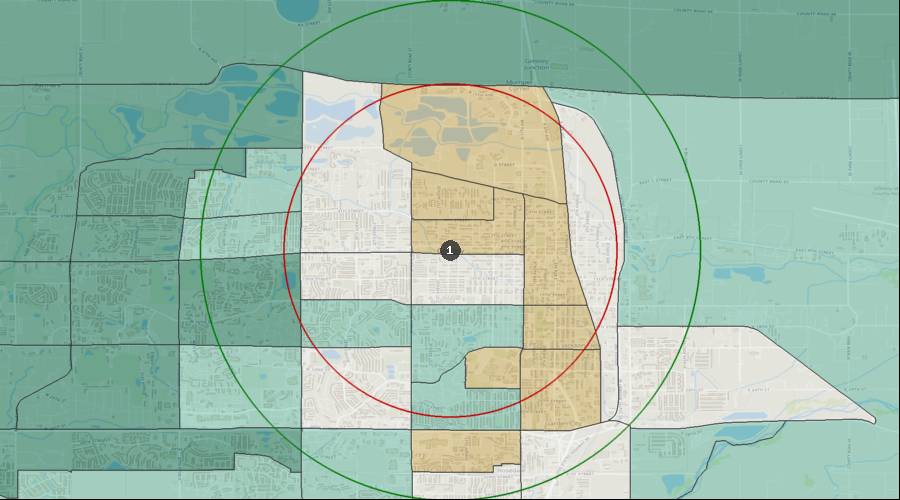
Percentage of the Population with a Bachelor's Degree
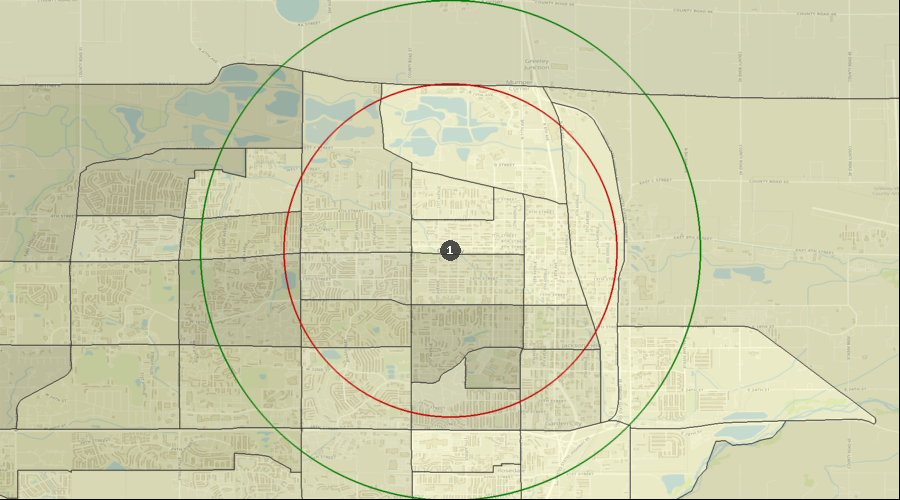
Education: Bach Deg by Census Tract | 42.19% to 52.00% |
| 32.98% to 42.19% |
| 23.79% to 32.98% |
| 15.17% to 23.79% |
| 4.80% to 15.17% |
| 1. | Greeley |
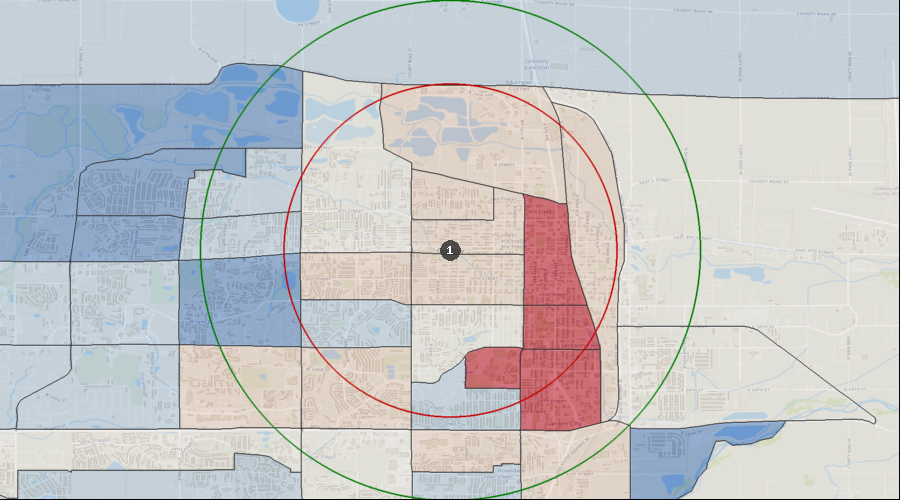
Lifestyle Behaviors – Household Entertainment/Recreation Average Expenditure
Ent/Recreation Per HH (Avg by Census Tract) | $2,977 to $4,782 |
| $2,321 to $2,977 |
| $1,635 to $2,321 |
| $0 to $1,635 |
| 1. | Greeley |
Projected Population Growth Rate
Projected Population Growth Per Year | 2.72% to 4.16% |
| 1.81% to 2.72% |
| 1.15% to 1.81% |
| 0.48% to 1.15% |
| -0.06% to 0.48% |
| 1. | Greeley |
Average Household Expenditure for Health Insurance
Health Insurance Avg/HH by Census Tract | $3,614 to $5,673 |
| $2,745 to $3,614 |
| $1,992 to $2,745 |
| $0 to $1,992 |
| 1. | Greeley |
Home Ownership Rates
Owner Occupied Households by Census Tract | 78.61% to 90.57% |
| 67.09% to 78.61% |
| 49.43% to 67.09% |
| 13.24% to 49.43% |
| 0.00% to 13.24% |
| 1. | Greeley |
Median Household Income
Median Household Income by Census Tract | $79k to $105k |
| $63k to $79k |
| $46k to $63k |
| $25k to $46k |
| $0k to $25k |
| 1. | Greeley |
Daily Average Traffic Count
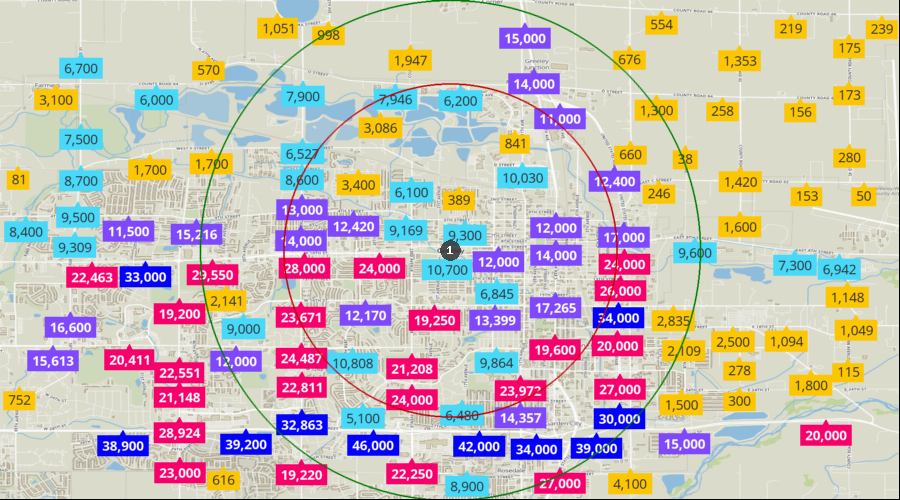
Traffic Counts | 30k to 46k |
| 19k to 30k |
| 11k to 19k |
| 5k to 11k |
| 0k to 5k |
| 1. | Greeley |