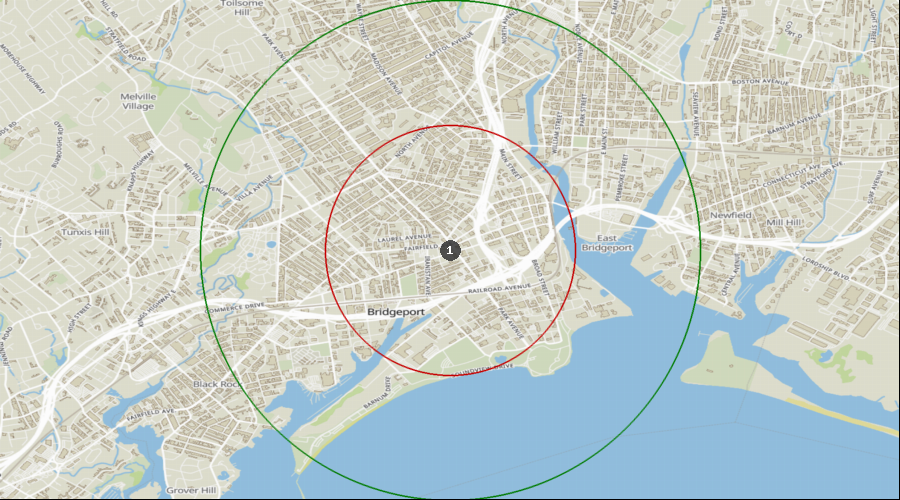
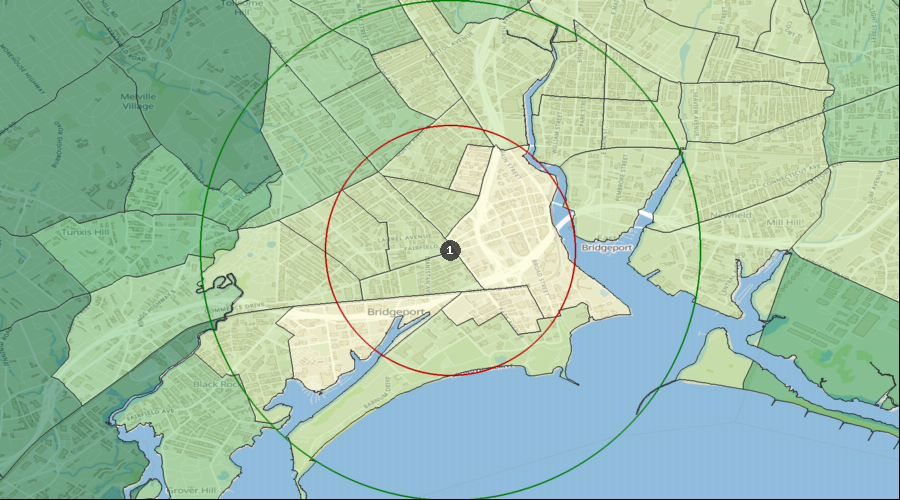
Bridgeport, Connecticut - Dental Demographics Maps
Want comprehensive data on dentist to population ratios?
A Denali Demographic Study looks at the information in demographic reports like historical data, market saturation, growth drivers, and dental specific statistics, and interprets all these dental demographics to provide a viability ranking that other demographic reports typically don’t provide.
Get a custom study for as little as $159
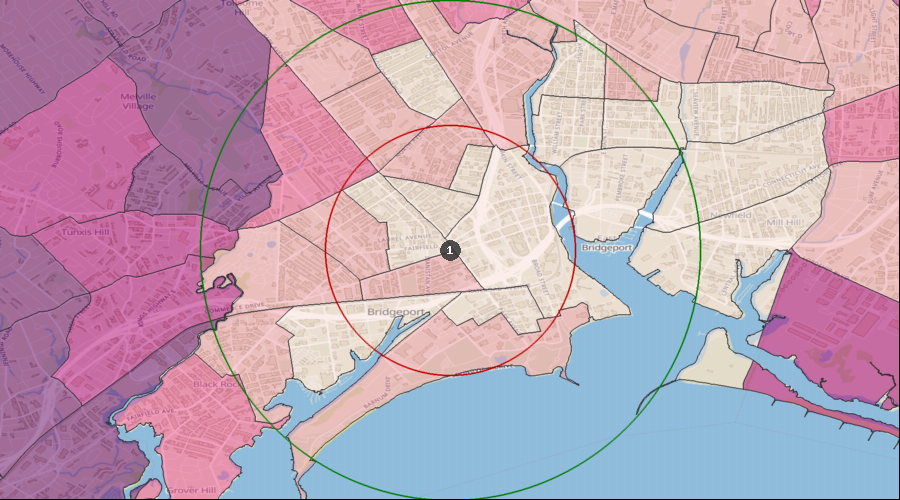
Average Dental Expenditures
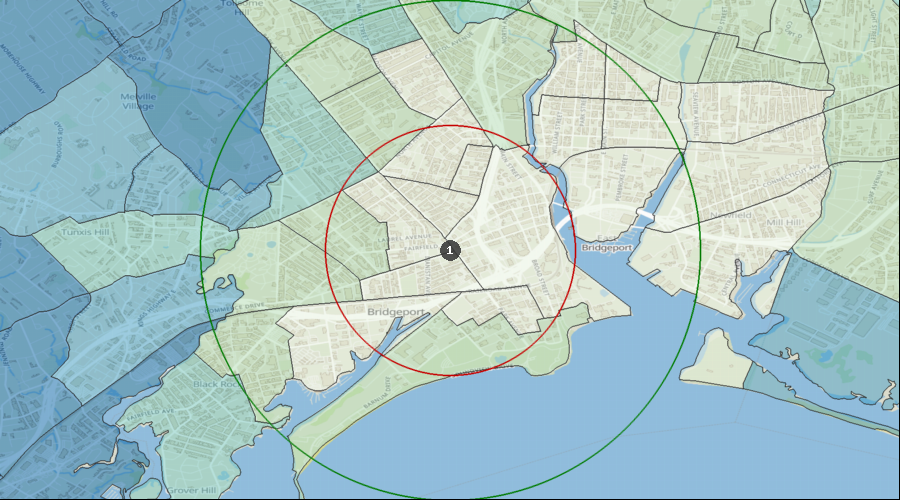
Dental Services per HH (Avg by Census Tract) | $526 to $995 |
| $432 to $526 |
| $295 to $432 |
| $205 to $295 |
| $58 to $205 |
| 1. | Bridgeport |
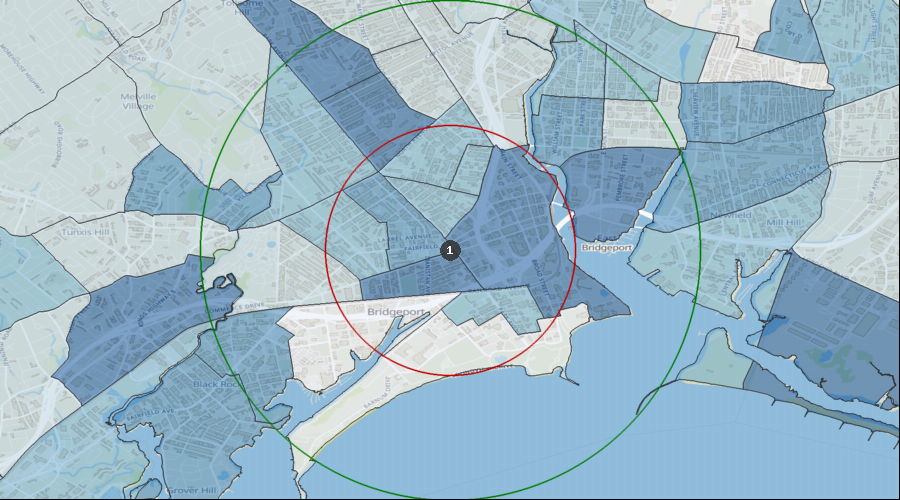
Percentage of the Population Visiting a Dentist in the Last 12 Months
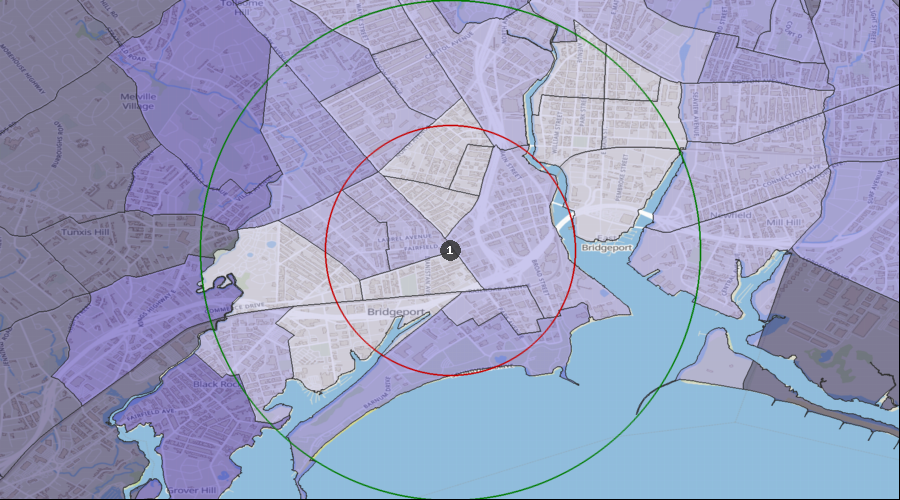
Visited a Dentist in Past 12 Months | 34.65% to 42.69% |
| 30.09% to 34.65% |
| 25.56% to 30.09% |
| 21.78% to 25.56% |
| 17.04% to 21.78% |
| 1. | Bridgeport |
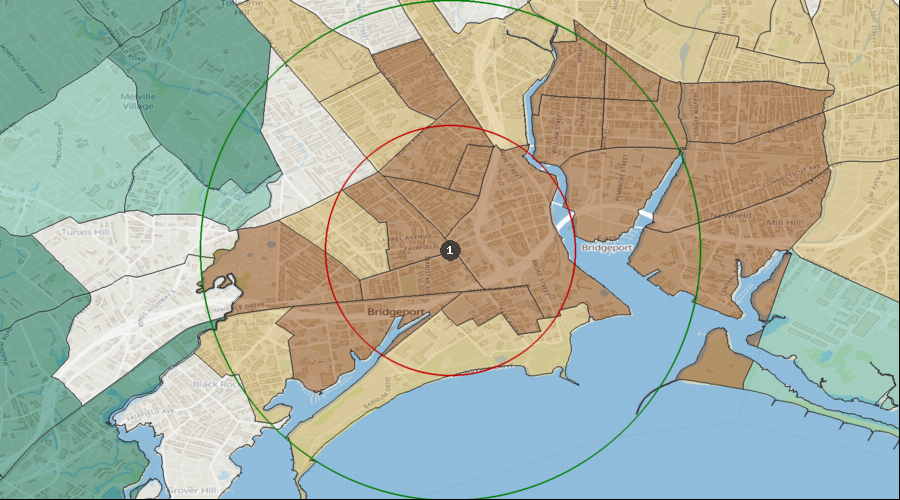
Percentage of the Population with a Bachelor's Degree
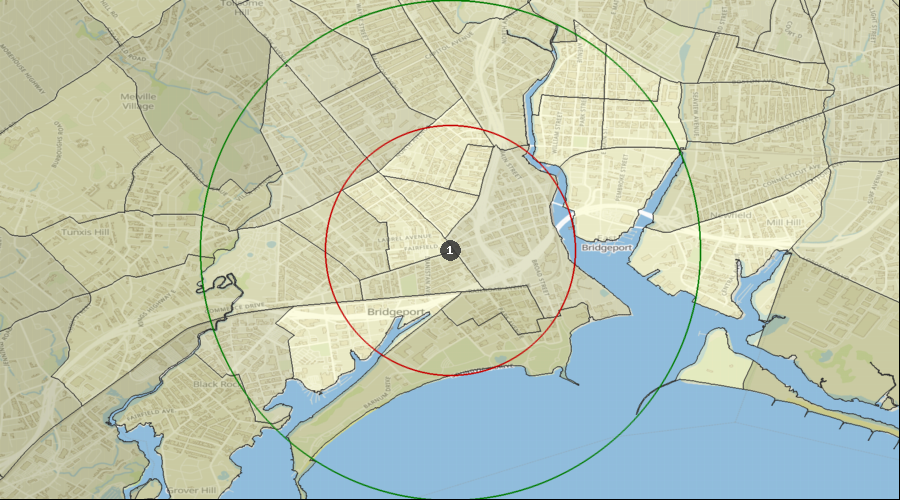
Education: Bach Deg by Census Tract | 51.08% to 74.40% |
| 27.96% to 51.08% |
| 18.13% to 27.96% |
| 9.62% to 18.13% |
| 1.94% to 9.62% |
| 1. | Bridgeport |
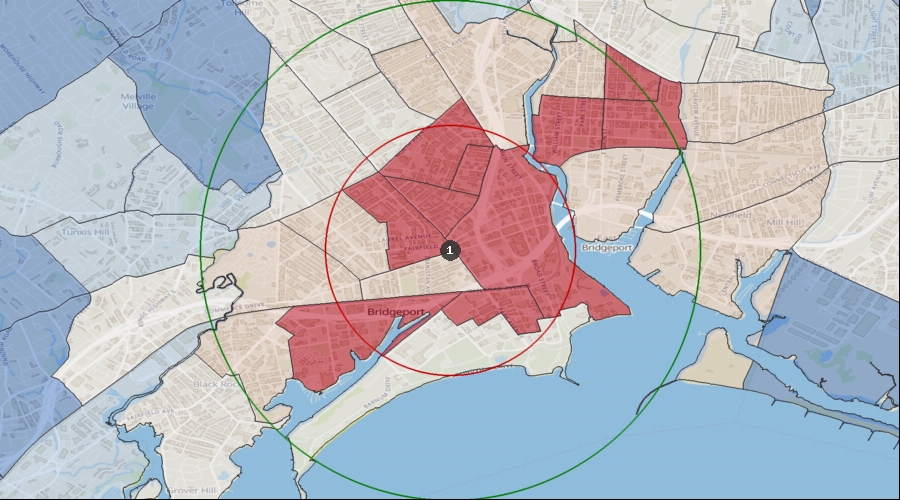
Lifestyle Behaviors – Household Entertainment/Recreation Average Expenditure
Ent/Recreation Per HH (Avg by Census Tract) | $4,399 to $8,091 |
| $3,336 to $4,399 |
| $2,526 to $3,336 |
| $1,836 to $2,526 |
| $689 to $1,836 |
| 1. | Bridgeport |
Projected Population Growth Rate
Projected Population Growth Per Year | 0.58% to 1.17% |
| 0.34% to 0.58% |
| 0.16% to 0.34% |
| -0.08% to 0.16% |
| -0.30% to -0.08% |
| 1. | Bridgeport |
Average Household Expenditure for Health Insurance
Health Insurance Avg/HH by Census Tract | $5,184 to $9,085 |
| $4,206 to $5,184 |
| $3,012 to $4,206 |
| $2,175 to $3,012 |
| $739 to $2,175 |
| 1. | Bridgeport |
Home Ownership Rates
Owner Occupied Households by Census Tract | 68.43% to 91.91% |
| 54.06% to 68.43% |
| 30.06% to 54.06% |
| 15.90% to 30.06% |
| 0.00% to 15.90% |
| 1. | Bridgeport |
Median Household Income
Median Household Income by Census Tract | $97k to $161k |
| $72k to $97k |
| $48k to $72k |
| $29k to $48k |
| $14k to $29k |
| 1. | Bridgeport |
Daily Average Traffic Count
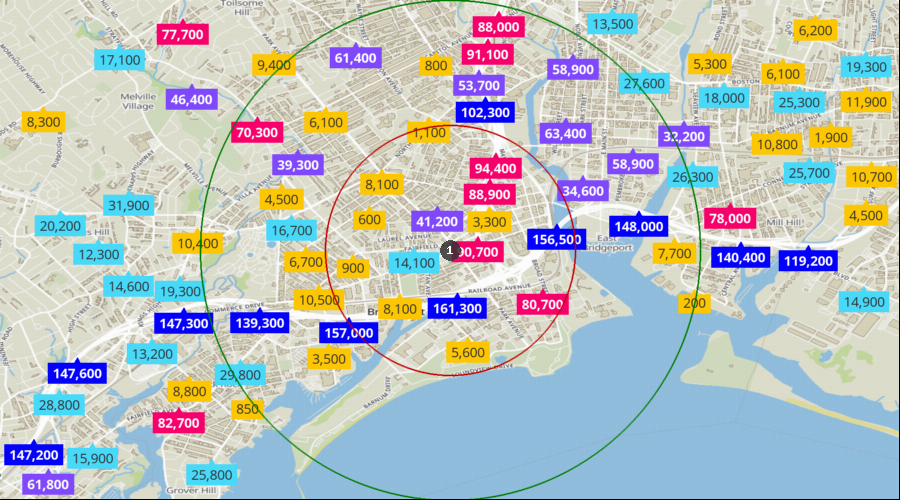
Traffic Counts | 102k to 161k |
| 64k to 102k |
| 32k to 64k |
| 12k to 32k |
| 0k to 12k |
| 1. | Bridgeport |