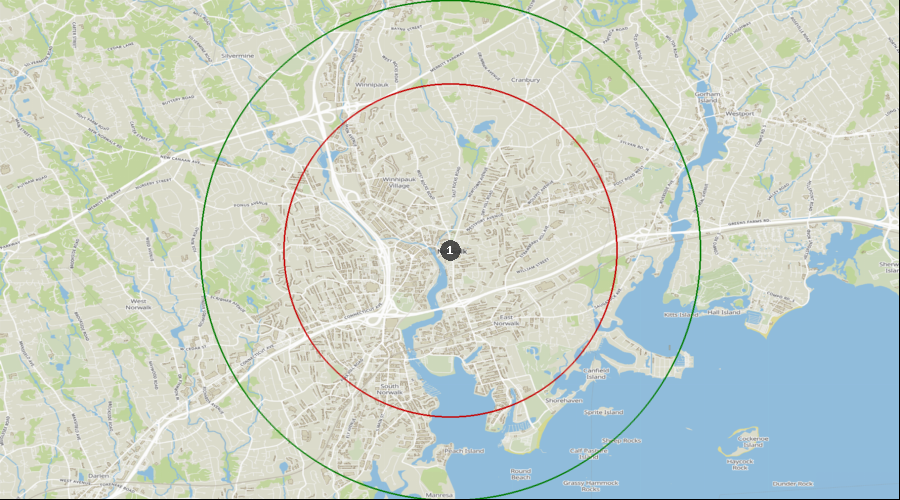
Norwalk, Connecticut - Dental Demographics Maps
Want comprehensive data on dentist to population ratios?
A Denali Demographic Study looks at the information in demographic reports like historical data, market saturation, growth drivers, and dental specific statistics, and interprets all these dental demographics to provide a viability ranking that other demographic reports typically don’t provide.
Get a custom study for as little as $159
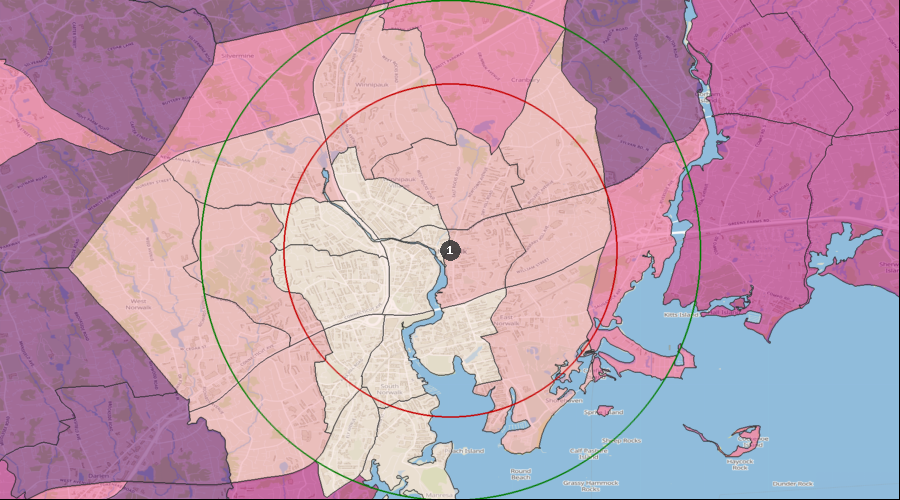
Average Dental Expenditures
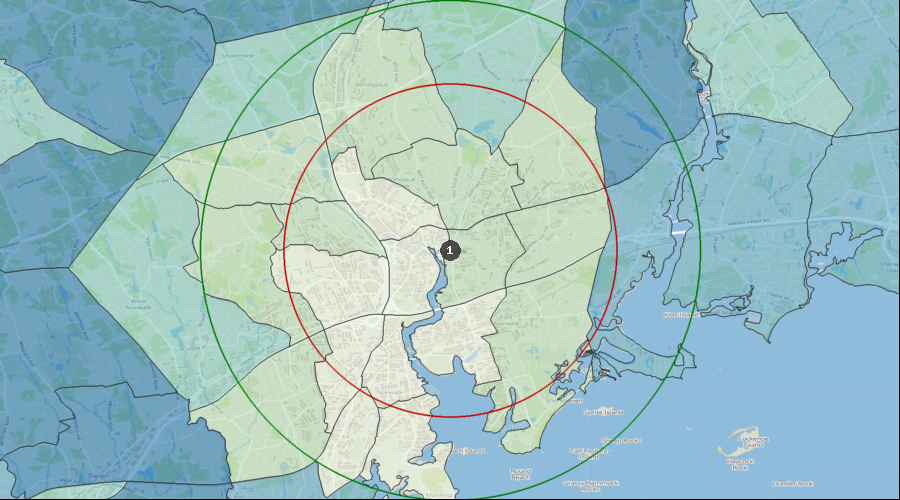
Dental Services per HH (Avg by Census Tract) | $1,140 to $1,395 |
| $938 to $1,140 |
| $651 to $938 |
| $406 to $651 |
| $231 to $406 |
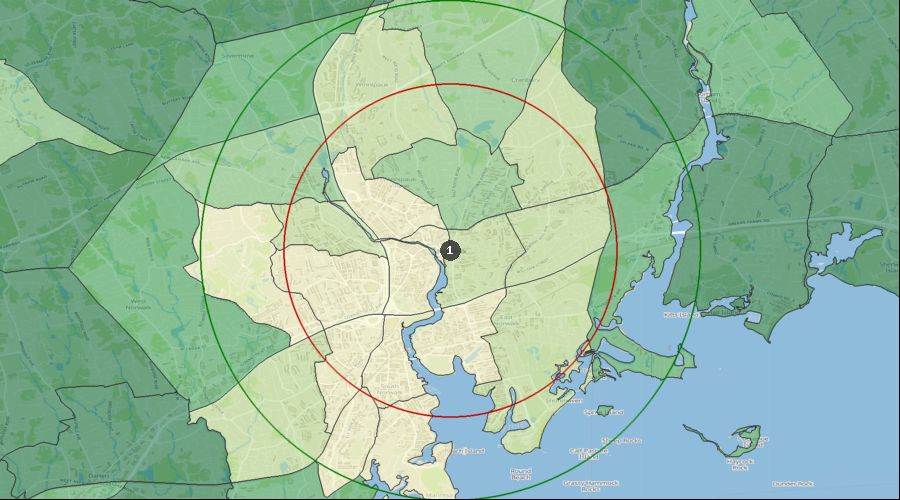
| 1. | Norwalk |
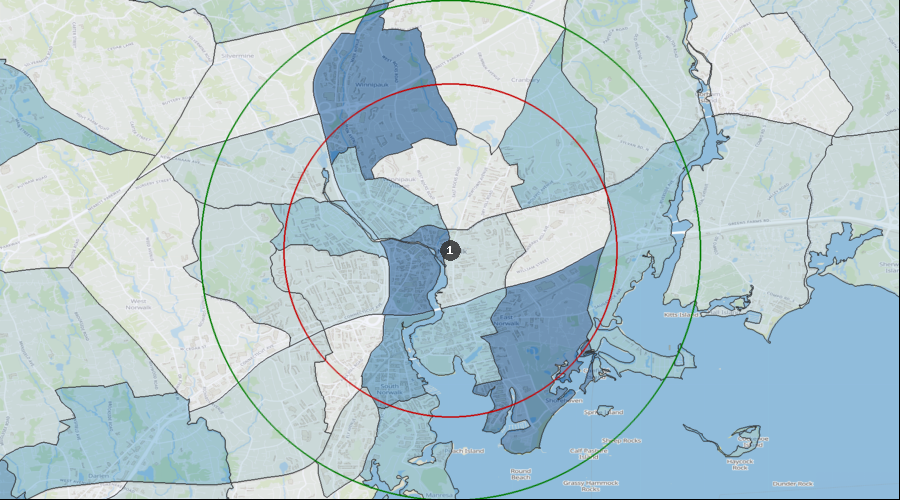
Percentage of the Population Visiting a Dentist in the Last 12 Months
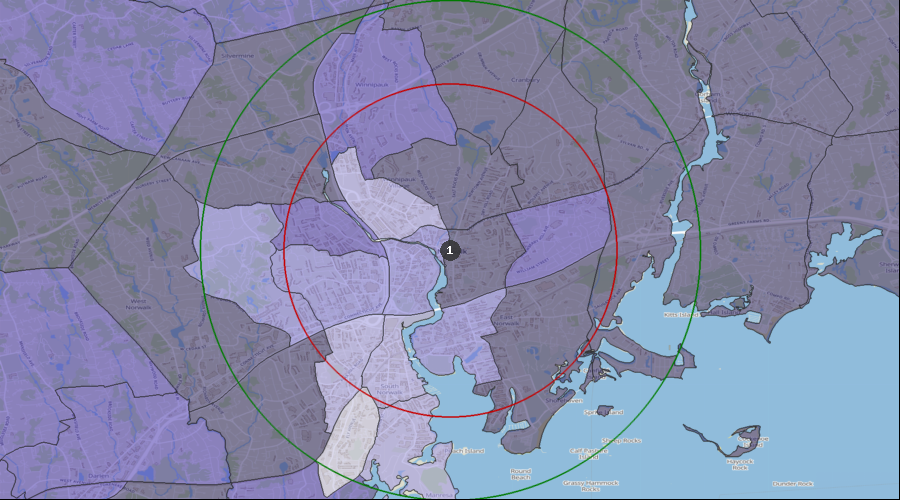
Visited a Dentist in Past 12 Months | 35.65% to 39.76% |
| 30.02% to 35.65% |
| 26.98% to 30.02% |
| 24.04% to 26.98% |
| 20.92% to 24.04% |
| 1. | Norwalk |
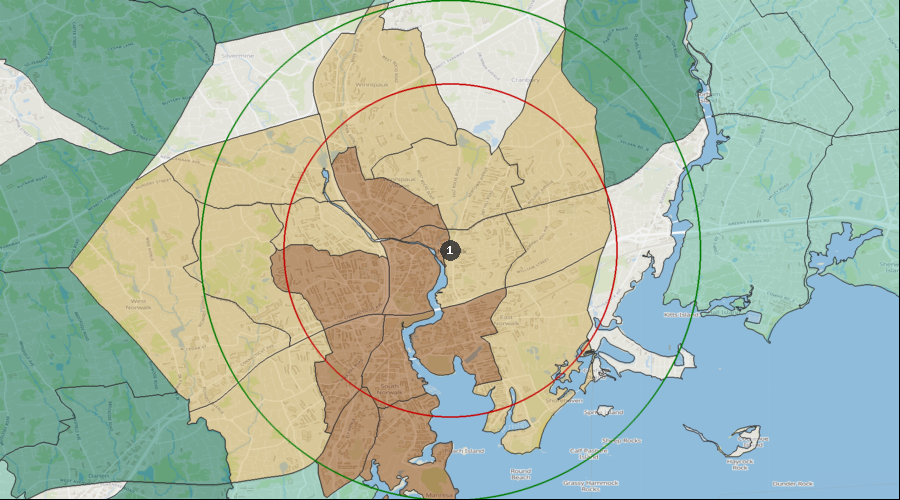
Percentage of the Population with a Bachelor's Degree
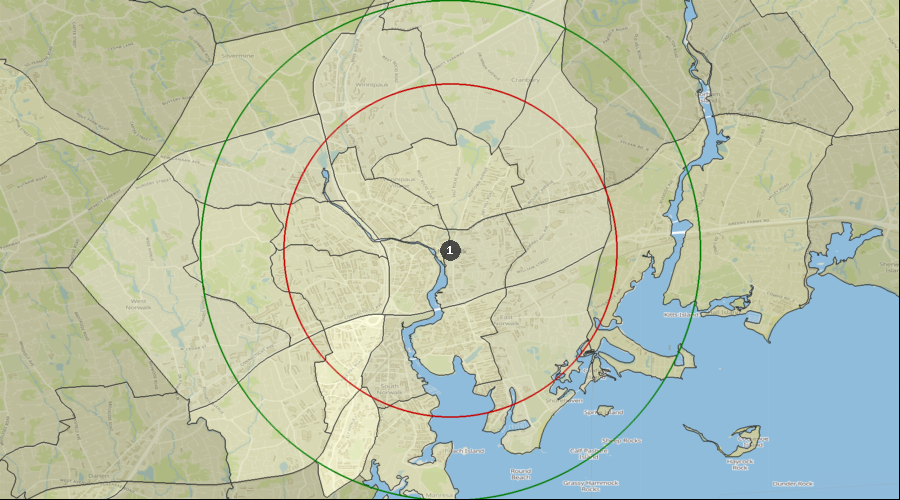
Education: Bach Deg by Census Tract | 74.73% to 89.37% |
| 55.15% to 74.73% |
| 42.43% to 55.15% |
| 23.71% to 42.43% |
| 14.39% to 23.71% |
| 1. | Norwalk |
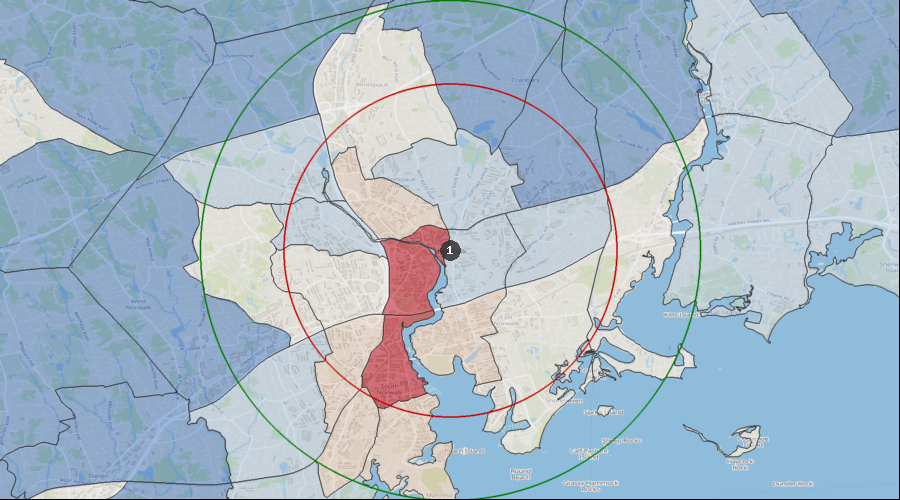
Lifestyle Behaviors – Household Entertainment/Recreation Average Expenditure
Ent/Recreation Per HH (Avg by Census Tract) | $9,554 to $11,714 |
| $7,827 to $9,554 |
| $6,002 to $7,827 |
| $3,394 to $6,002 |
| $2,039 to $3,394 |
| 1. | Norwalk |
Projected Population Growth Rate
Projected Population Growth Per Year | 1.18% to 3.54% |
| 0.76% to 1.18% |
| 0.49% to 0.76% |
| 0.22% to 0.49% |
| -0.21% to 0.22% |
| 1. | Norwalk |
Average Household Expenditure for Health Insurance
Health Insurance Avg/HH by Census Tract | $10,770 to $13,205 |
| $8,797 to $10,770 |
| $6,638 to $8,797 |
| $3,841 to $6,638 |
| $2,247 to $3,841 |
| 1. | Norwalk |
Home Ownership Rates
Owner Occupied Households by Census Tract | 77.65% to 91.52% |
| 64.71% to 77.65% |
| 41.33% to 64.71% |
| 25.33% to 41.33% |
| 10.94% to 25.33% |
| 1. | Norwalk |
Median Household Income
Median Household Income by Census Tract | $170k to $200k |
| $127k to $170k |
| $109k to $127k |
| $79k to $109k |
| $44k to $79k |
| 1. | Norwalk |
Daily Average Traffic Count
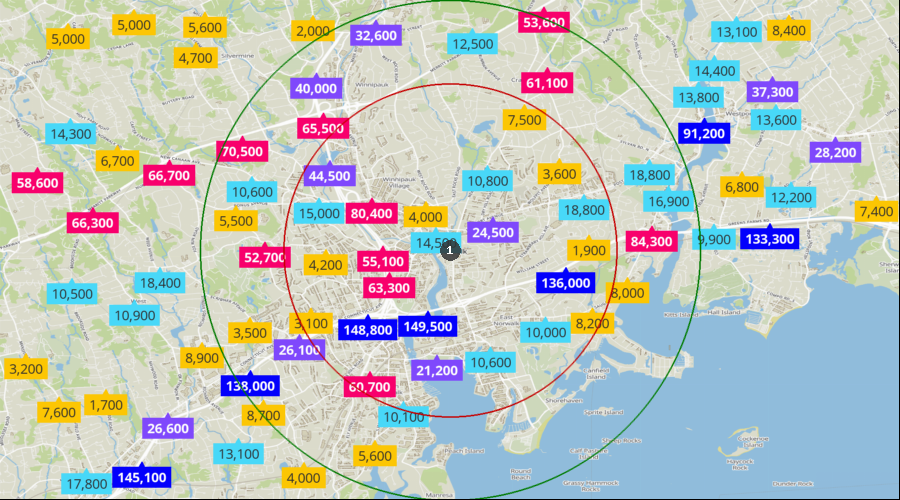
Traffic Counts | 91k to 150k |
| 45k to 91k |
| 21k to 45k |
| 9k to 21k |
| 0k to 9k |
| 1. | Norwalk |