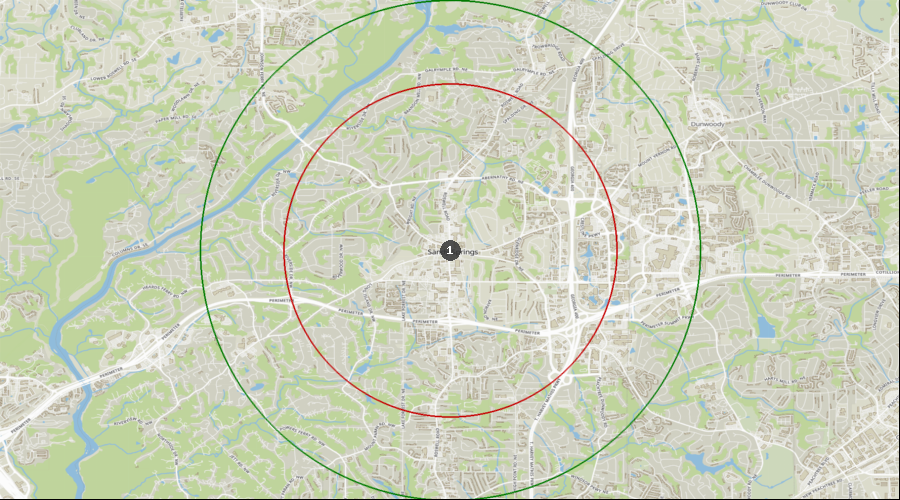
Sandy Springs, Georgia - Dental Demographics Maps
Want comprehensive data on dentist to population ratios?
A Denali Demographic Study looks at the information in demographic reports like historical data, market saturation, growth drivers, and dental specific statistics, and interprets all these dental demographics to provide a viability ranking that other demographic reports typically don’t provide.
Get a custom study for as little as $159
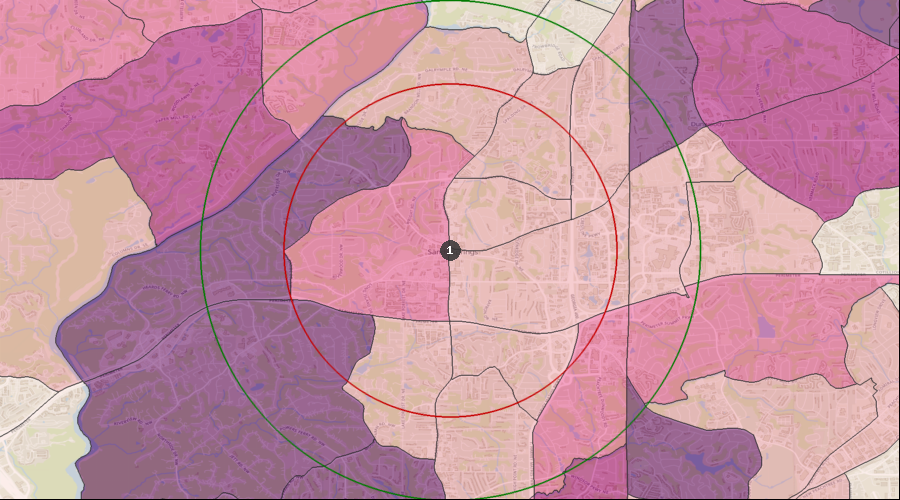
Average Dental Expenditures
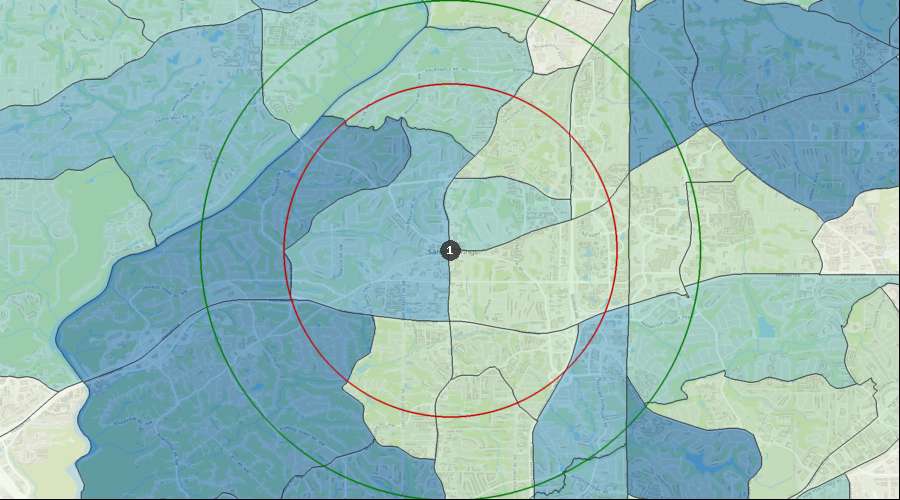
Dental Services per HH (Avg by Census Tract) | $934 to $1,173 |
| $753 to $934 |
| $548 to $753 |
| $338 to $548 |
| $162 to $338 |
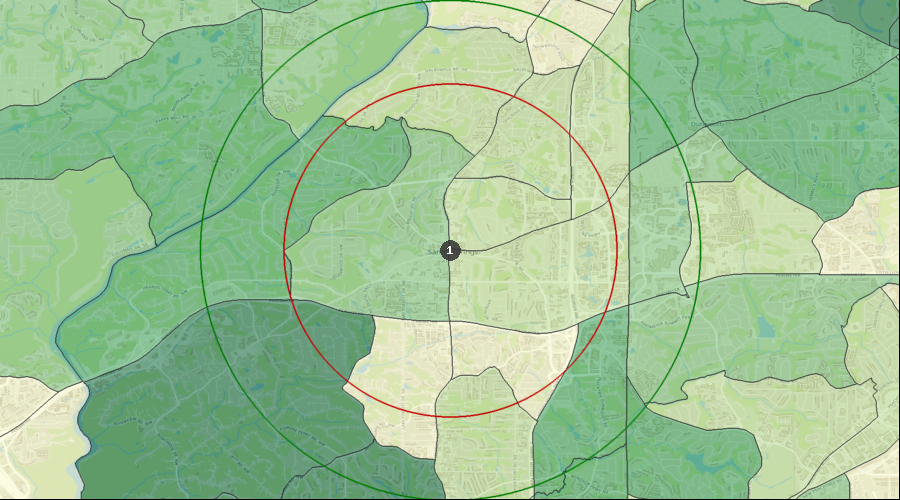
| 1. | Sandy Springs |
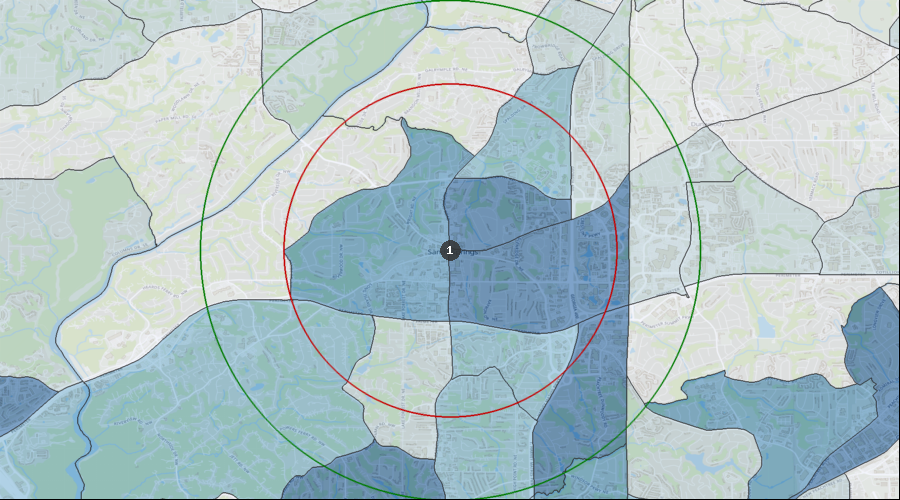
Percentage of the Population Visiting a Dentist in the Last 12 Months
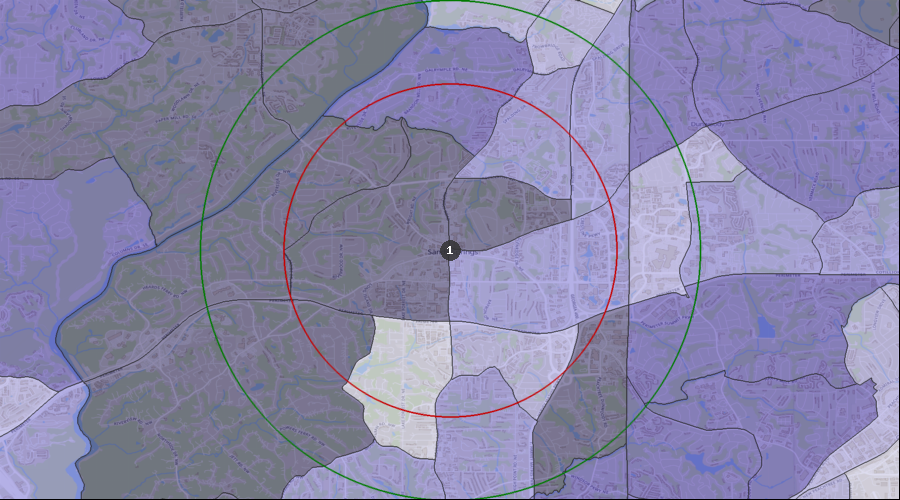
Visited a Dentist in Past 12 Months | 38.17% to 43.74% |
| 35.21% to 38.17% |
| 31.45% to 35.21% |
| 27.00% to 31.45% |
| 21.82% to 27.00% |
| 1. | Sandy Springs |
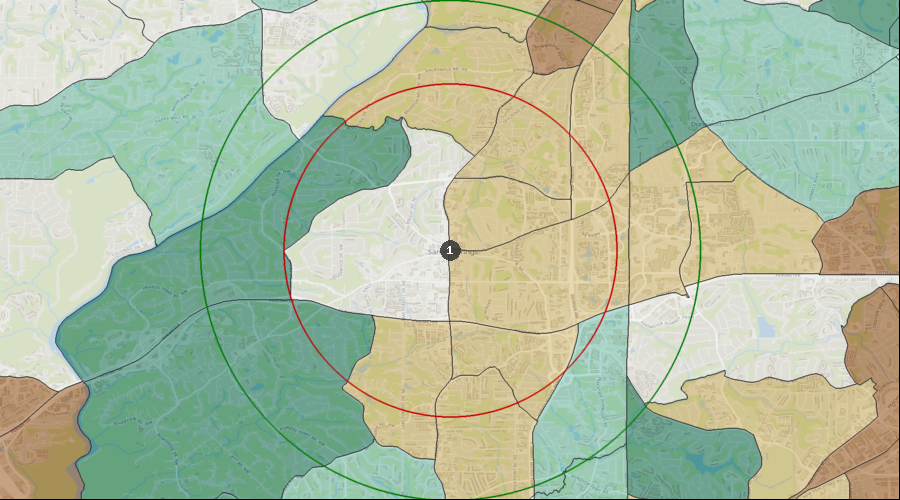
Percentage of the Population with a Bachelor's Degree
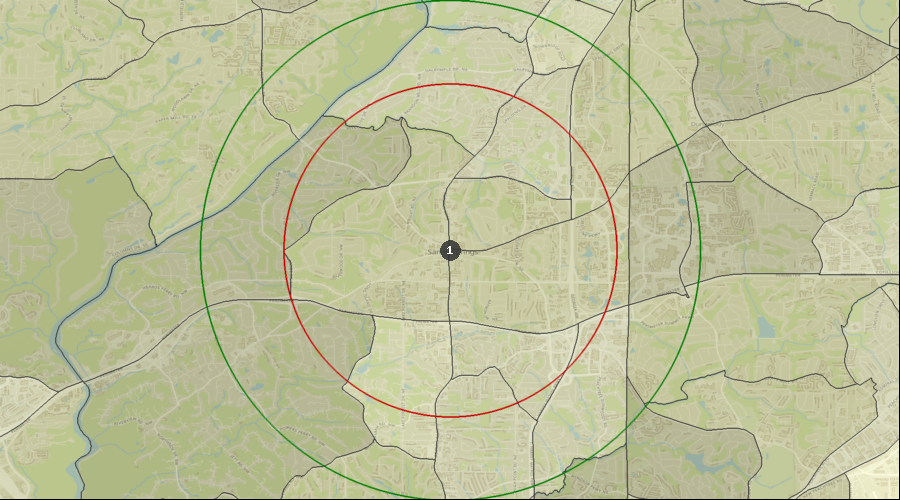
Education: Bach Deg by Census Tract | 76.88% to 88.09% |
| 65.66% to 76.88% |
| 46.66% to 65.66% |
| 3.96% to 46.66% |
| 1. | Sandy Springs |
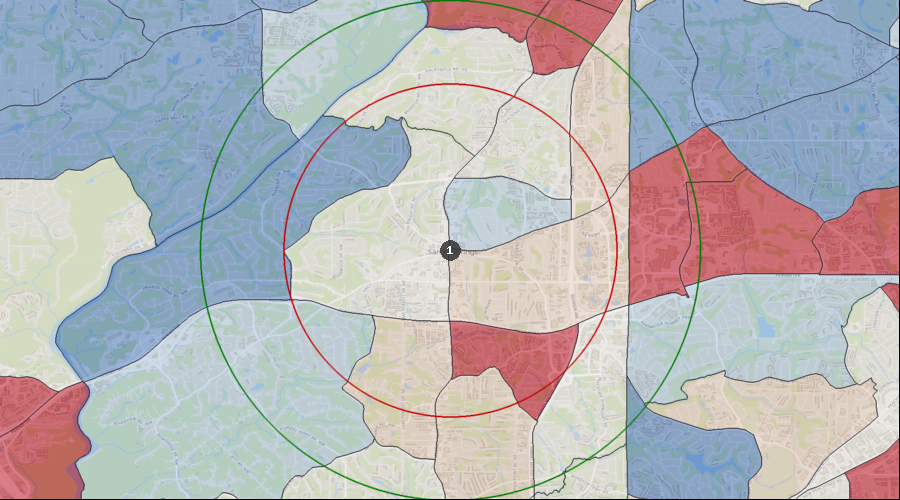
Lifestyle Behaviors – Household Entertainment/Recreation Average Expenditure
Ent/Recreation Per HH (Avg by Census Tract) | $7,968 to $9,817 |
| $6,647 to $7,968 |
| $5,047 to $6,647 |
| $3,365 to $5,047 |
| $1,574 to $3,365 |
| 1. | Sandy Springs |
Projected Population Growth Rate
Projected Population Growth Per Year | 3.07% to 5.12% |
| 2.22% to 3.07% |
| 1.27% to 2.22% |
| 0.74% to 1.27% |
| -0.21% to 0.74% |
| 1. | Sandy Springs |
Average Household Expenditure for Health Insurance
Health Insurance Avg/HH by Census Tract | $8,899 to $11,066 |
| $7,272 to $8,899 |
| $5,763 to $7,272 |
| $3,772 to $5,763 |
| $1,762 to $3,772 |
| 1. | Sandy Springs |
Home Ownership Rates
Owner Occupied Households by Census Tract | 83.32% to 96.58% |
| 63.19% to 83.32% |
| 41.22% to 63.19% |
| 25.36% to 41.22% |
| 3.00% to 25.36% |
| 1. | Sandy Springs |
Median Household Income
Median Household Income by Census Tract | $168k to $200k |
| $124k to $168k |
| $96k to $124k |
| $67k to $96k |
| $33k to $67k |
| 1. | Sandy Springs |
Daily Average Traffic Count
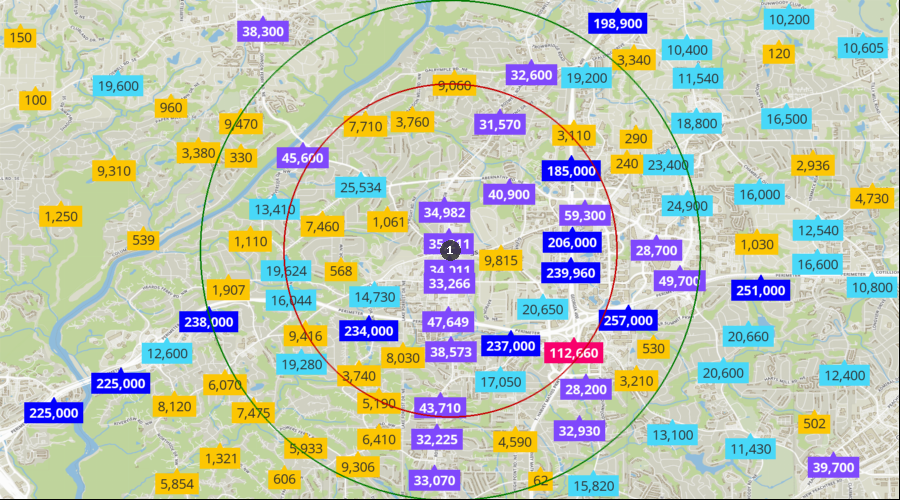
Traffic Counts | 159k to 257k |
| 81k to 159k |
| 27k to 81k |
| 10k to 27k |
| 0k to 10k |
| 1. | Sandy Springs |