![]() | Population |
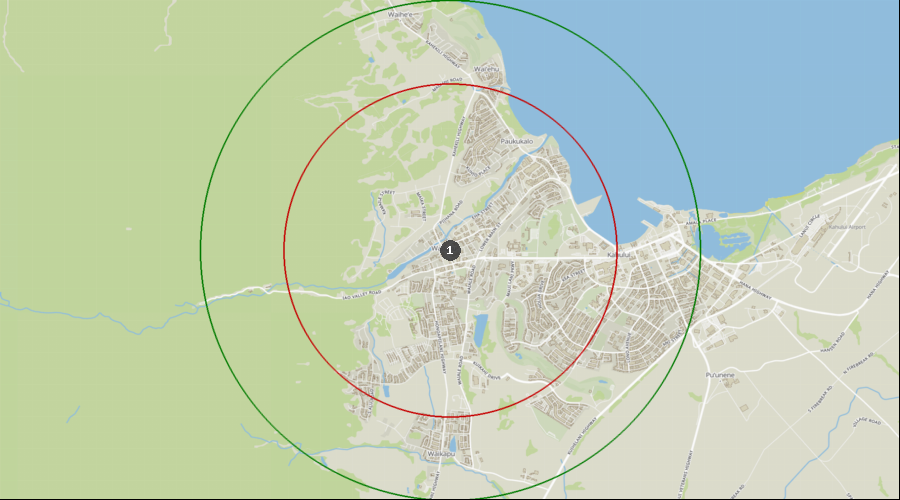
Wailuku's current population is 42,333 people with 12,979 households within this smaller 2 mile radius. This area experienced positive population growth of 8.3% from 2010-2020. This area is projected to grow another 1.0% over the next five years. This is lower than the national average.
The median age of the population in this area is 41.4 which is the same as the state average of 41.4 years old. This area has an average household size of 3.16 persons. This area is family centric with 69.0% of the households being family households and with 39.4% having children in the home and 17.5% of the population being under 15 and an additional 12.2% being under 24. Another 24.9% of this area’s population is between 25 and 44 years of age and 25.1% between 45-64 years old leaving 20.2% of the population over 65 years old. These last two age groups are target age groups for dentures, partials, crowns, and other restorative work.
Wailuku has a daytime employee population of 20,683 versus a permanent population of 42,333 meaning the daytime employee population is 48.9% of the permanent population living in the area and 48.0% of the total daytime population. Because the daytime employee population is a lower percentage of the daytime population, the employee population does not have as much influence on the overall residential population. A practice in this 2 mile radius could greatly benefit with early or late hours and weekend times.
| |
In this area, 31.3% of the population either holds a bachelor's degree or higher educational degree. Wailuku is lower than the state and US average.
The dominant racial and ethnic groups of the population in the Wailuku area are White 15.8%, Asian 40.5%, Pacific Islanders 14.1%, 1.7% other races and 10.0% Hispanic or Latino of any race.
|  | Table #2 Significant Demographic Characteristics |
| |
Demographic Analysis for Wailuku, Hawaii
|
|
|
|
|
| POPULATION | | | | |
| Population 2025 | | 42,333 | 61,671 | 1,460,442 | 338,440,954 |
| 2010 Total Population | | 37,067 | 53,313 | 1,361,792 | 309,121,785 |
| 2020 Total Population | | 40,155 | 58,440 | 1,455,571 | 331,839,624 |
| Projected Total Population 2030 | 42,777 | 62,301 | 1,471,853 | 344,873,411 |
| Population Change, 2010 - 2020 | 8.3% | 9.6% | 6.9% | 7.3% |
| Annual Population Change Rate, 2025 - 2030 | 0.2% | 0.2% | 0.2% | 0.4% |
| POPULATION AGE BREAKDOWN | | | | |
| Median Age | 41.4 | 40.7 | 41.4 | 39.3 |
| Under 4 years old | 5.5% | 5.5% | 5.3% | 5.5% |
| 5 - 9 years old | 5.9% | 6.0% | 5.5% | 5.8% |
| 10 - 14 years old | 6.1% | 6.6% | 5.5% | 6.0% |
| 15 - 24 years old | 12.2% | 12.3% | 12.2% | 13.2% |
| 25 - 44 years old | 24.9% | 25.3% | 26.3% | 26.9% |
| Number of Adults 25-44 | 10,555 | 15,576 | 384,566 | 90,938,228 |
| 45 - 64 years old | 25.1% | 25.1% | 24.4% | 24.4% |
| Number of Adults 45-64 | 10,611 | 15,469 | 356,897 | 82,485,679 |
| 65 years and over | 20.2% | 19.2% | 20.7% | 18.1% |
| Number of Adults 65 years and older | 8,566 | 11,843 | 302,833 | 61,399,291 |
| 0 - 14 years old | 17.5% | 18.1% | 16.3% | 17.4% |
| Number of Children 0-14 years old | 7,421 | 11,170 | 238,338 | 58,800,947 |
NOTE: All percentages are rounded. ESRI data pulled as of August 26, 2025. Data showing future dates are projections.
| | Highlighted fields signify favorable characteristics on a comparison basis with the other locations listed and/or national averages |