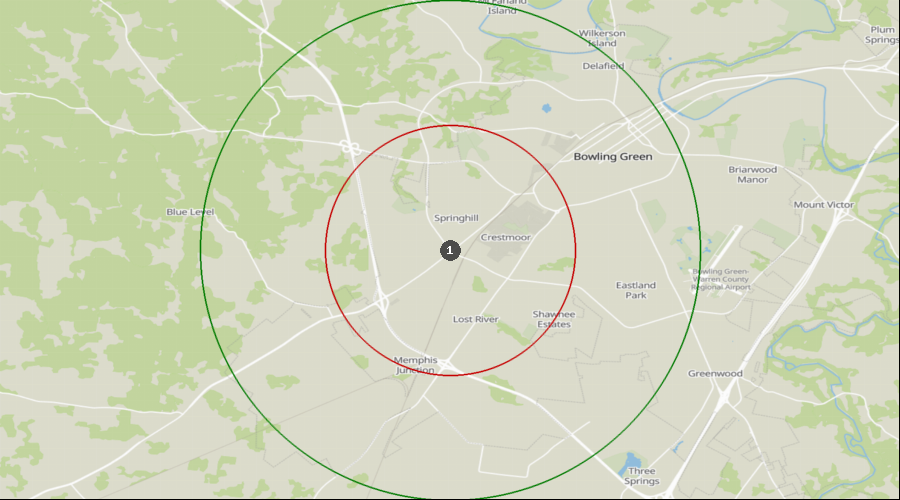
Bowling Green, Kentucky - Dental Demographics Maps
Want comprehensive data on dentist to population ratios?
A Denali Demographic Study looks at the information in demographic reports like historical data, market saturation, growth drivers, and dental specific statistics, and interprets all these dental demographics to provide a viability ranking that other demographic reports typically don’t provide.
Get a custom study for as little as $159
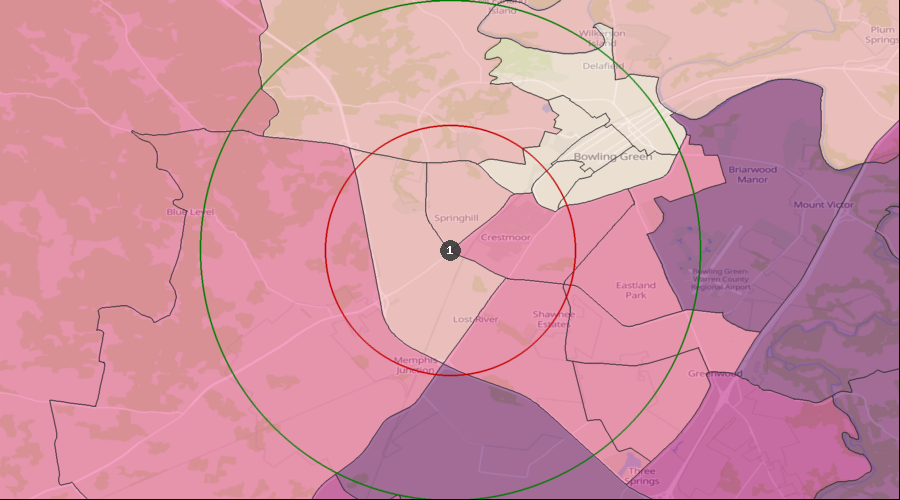
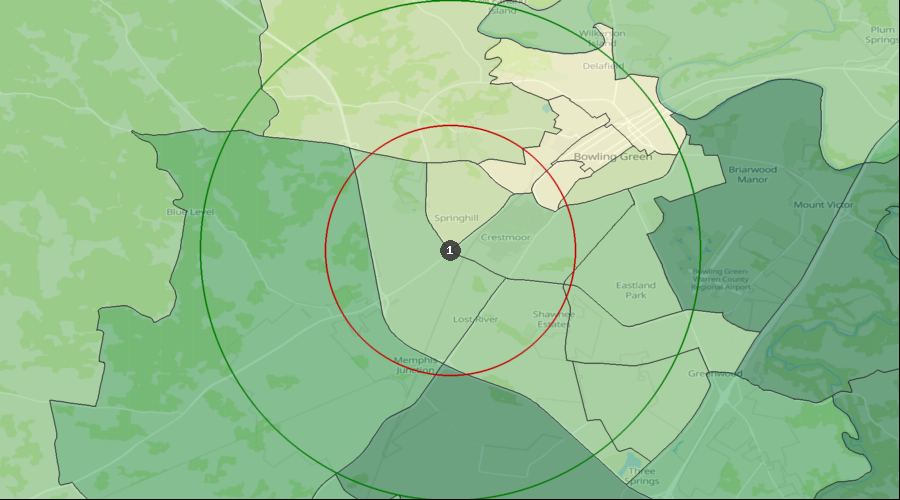
Average Dental Expenditures
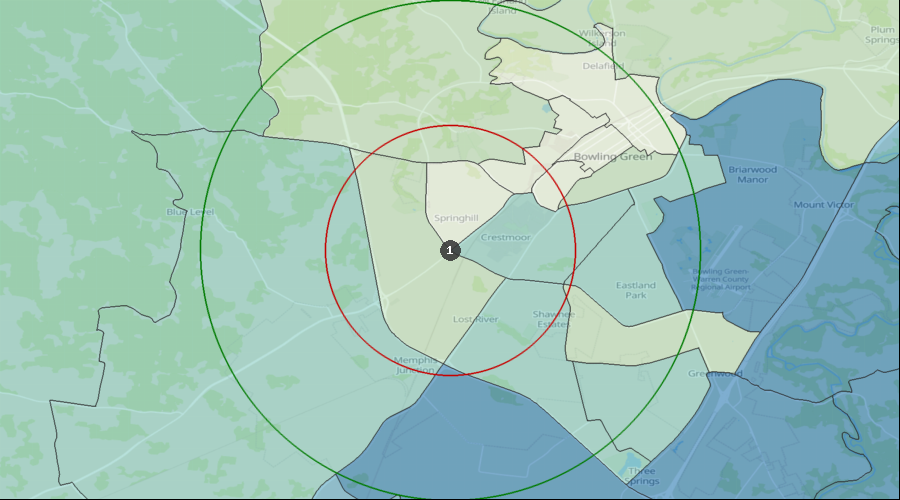
Dental Services per HH (Avg by Census Tract) | $382 to $526 |
| $338 to $382 |
| $261 to $338 |
| $164 to $261 |
| $108 to $164 |
| 1. | Bowling Green |
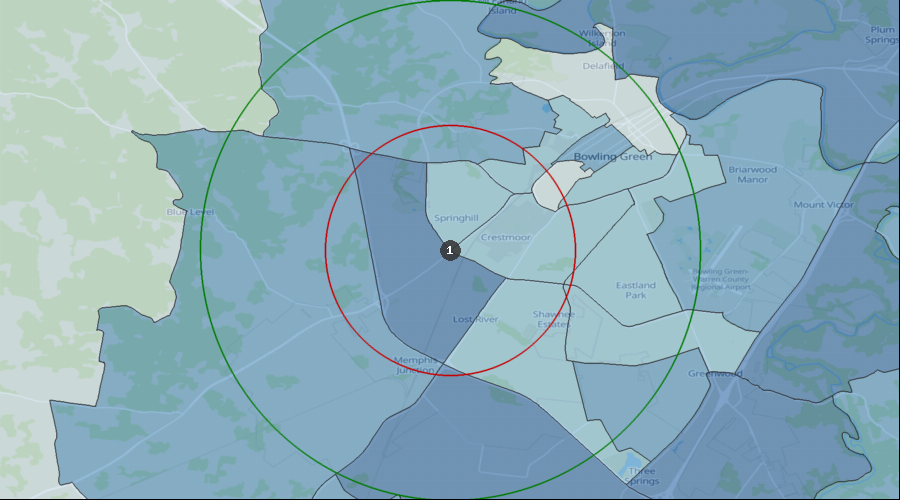
Percentage of the Population Visiting a Dentist in the Last 12 Months
Visited a Dentist in Past 12 Months | 31.74% to 37.76% |
| 29.13% to 31.74% |
| 26.56% to 29.13% |
| 23.68% to 26.56% |
| 21.82% to 23.68% |
| 1. | Bowling Green |
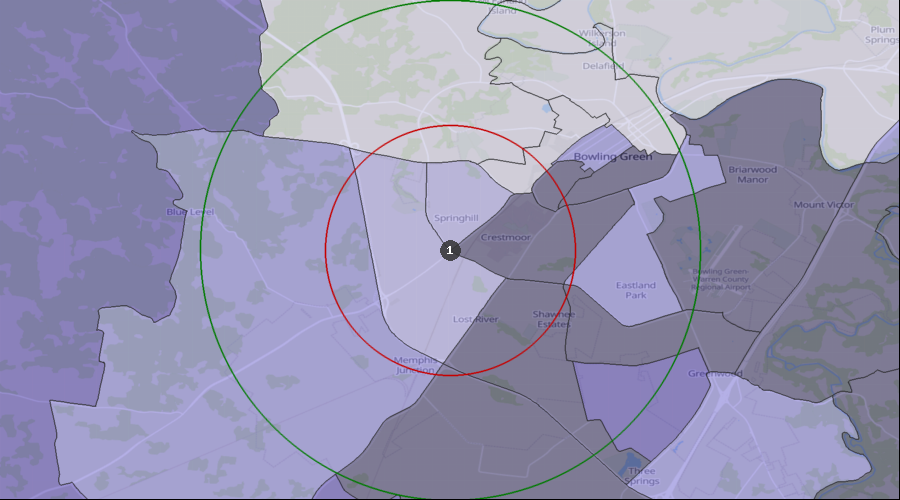
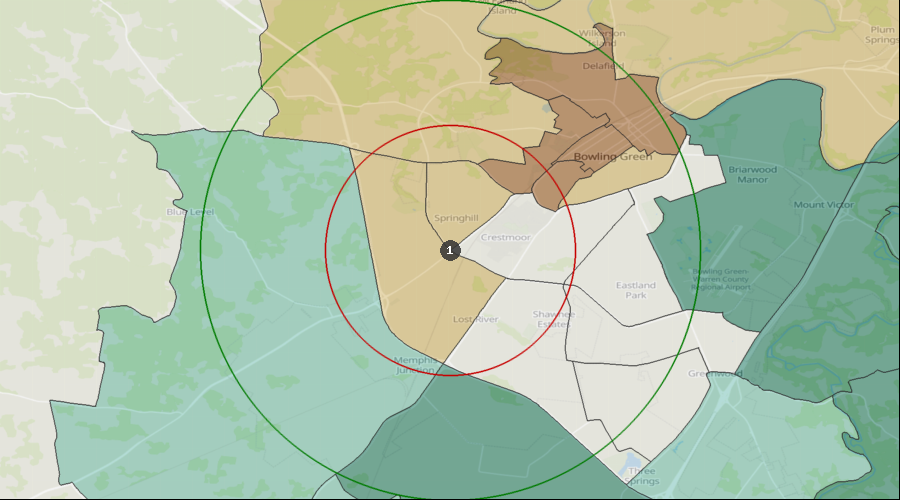
Percentage of the Population with a Bachelor's Degree
Education: Bach Deg by Census Tract | 47.39% to 63.84% |
| 38.35% to 47.39% |
| 25.56% to 38.35% |
| 15.61% to 25.56% |
| 9.69% to 15.61% |
| 1. | Bowling Green |
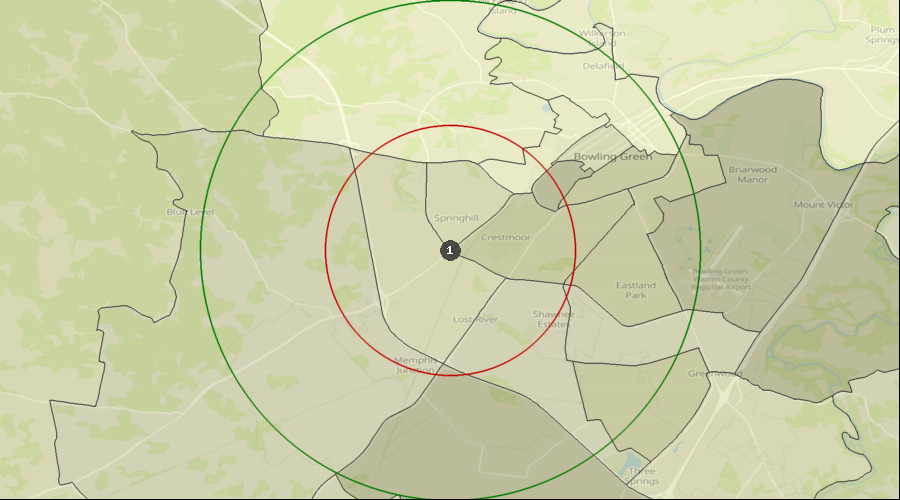
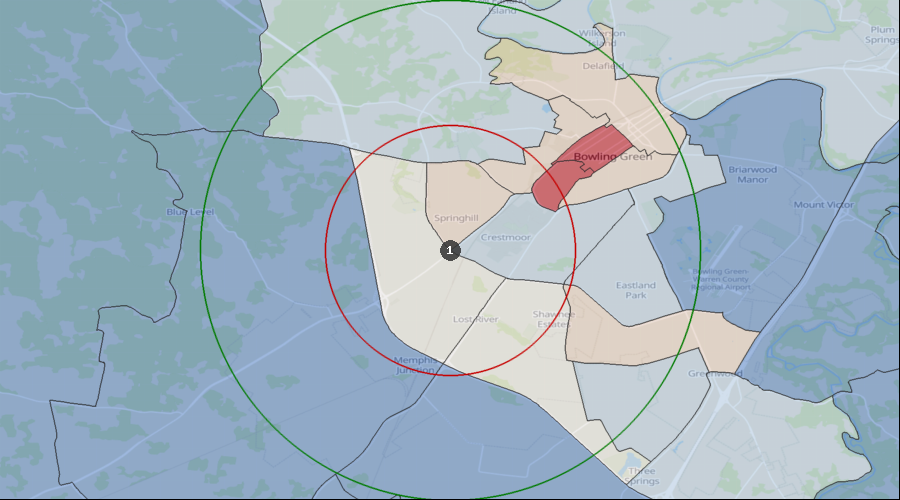
Lifestyle Behaviors – Household Entertainment/Recreation Average Expenditure
Ent/Recreation Per HH (Avg by Census Tract) | $3,987 to $5,375 |
| $3,013 to $3,987 |
| $2,082 to $3,013 |
| $1,539 to $2,082 |
| $1,127 to $1,539 |
| 1. | Bowling Green |
Projected Population Growth Rate
Projected Population Growth Per Year | 1.73% to 4.45% |
| 1.26% to 1.73% |
| 0.89% to 1.26% |
| 0.00% to 0.89% |
| 1. | Bowling Green |
Average Household Expenditure for Health Insurance
Health Insurance Avg/HH by Census Tract | $4,670 to $6,408 |
| $3,418 to $4,670 |
| $2,637 to $3,418 |
| $1,798 to $2,637 |
| $1,223 to $1,798 |
| 1. | Bowling Green |
Home Ownership Rates
Owner Occupied Households by Census Tract | 63.28% to 91.07% |
| 41.75% to 63.28% |
| 31.33% to 41.75% |
| 14.55% to 31.33% |
| 7.43% to 14.55% |
| 1. | Bowling Green |
Median Household Income
Median Household Income by Census Tract | $79k to $106k |
| $52k to $79k |
| $36k to $52k |
| $27k to $36k |
| $19k to $27k |
| 1. | Bowling Green |
Daily Average Traffic Count
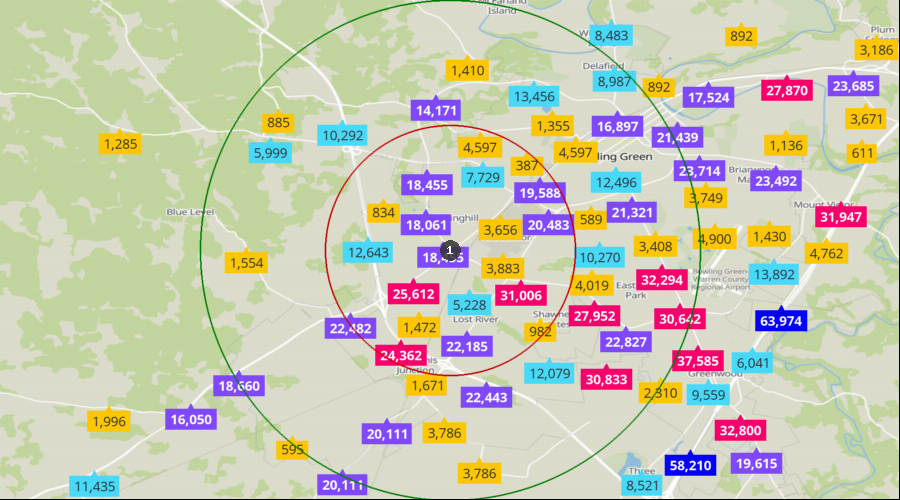
Traffic Counts | 38k to 64k |
| 24k to 38k |
| 14k to 24k |
| 5k to 14k |
| 0k to 5k |
| 1. | Bowling Green |