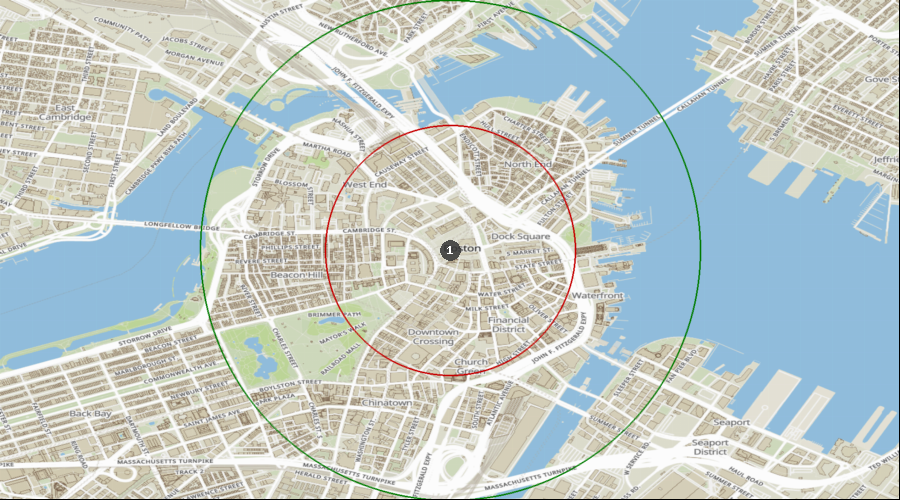
Boston, Massachusetts - Dental Demographics Maps
Want comprehensive data on dentist to population ratios?
A Denali Demographic Study looks at the information in demographic reports like historical data, market saturation, growth drivers, and dental specific statistics, and interprets all these dental demographics to provide a viability ranking that other demographic reports typically don’t provide.
Get a custom study for as little as $159
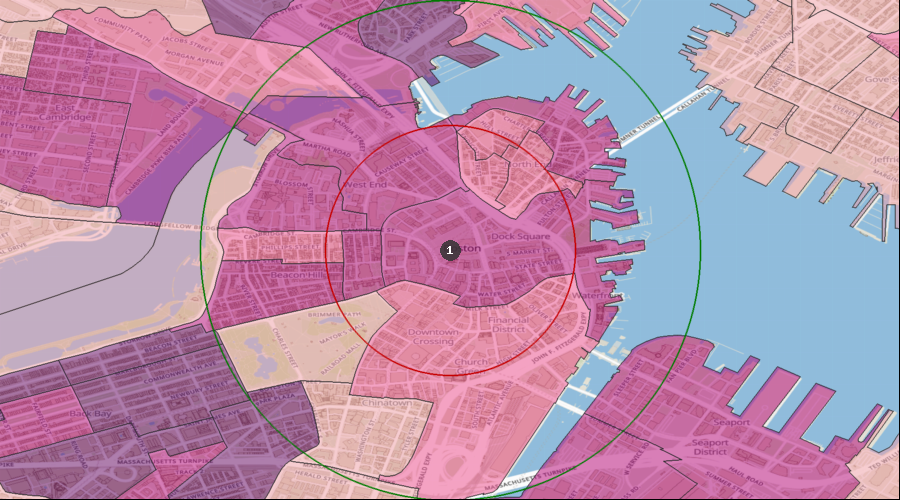
Average Dental Expenditures
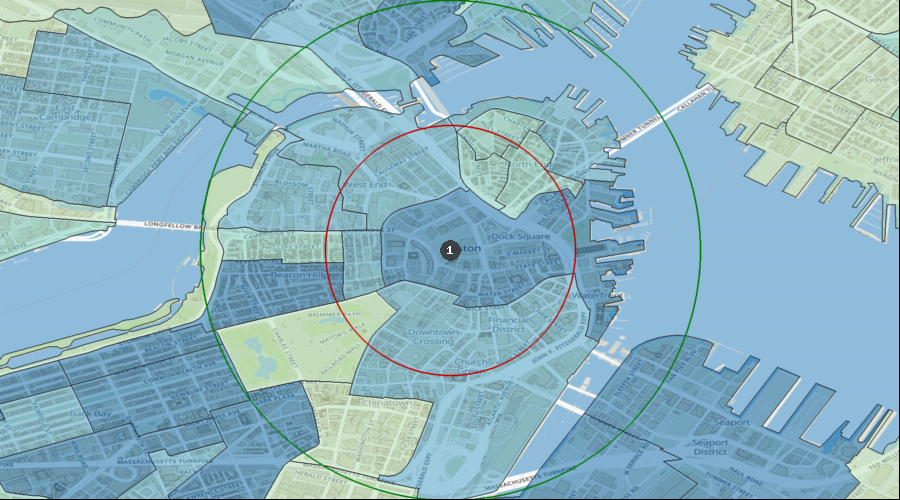
Dental Services per HH (Avg by Census Tract) | $651 to $787 |
| $523 to $651 |
| $369 to $523 |
| $0 to $369 |
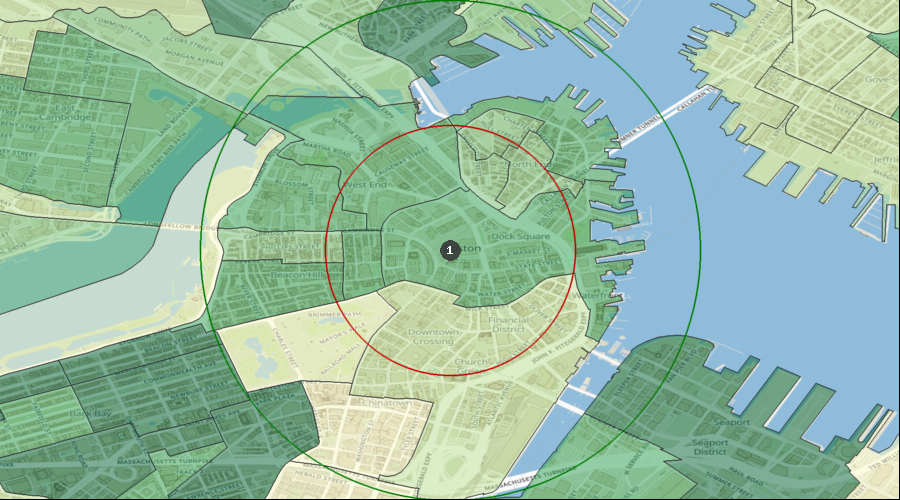
| 1. | Boston |
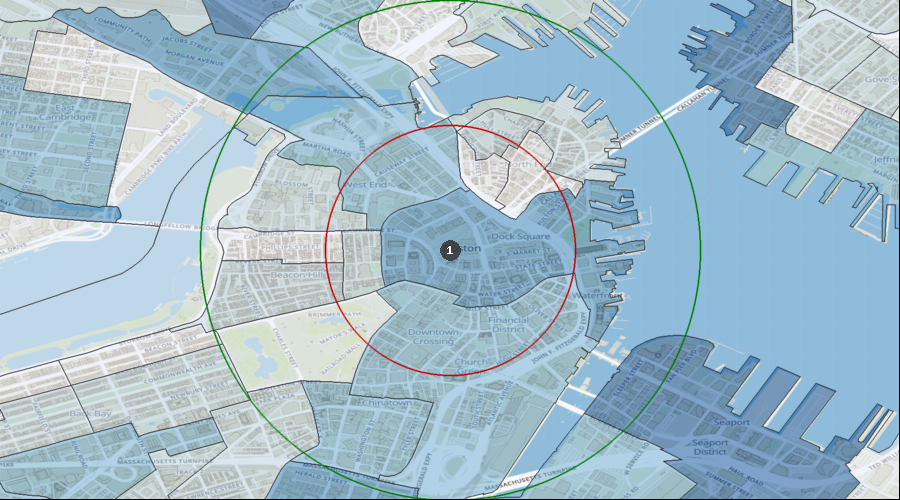
Percentage of the Population Visiting a Dentist in the Last 12 Months
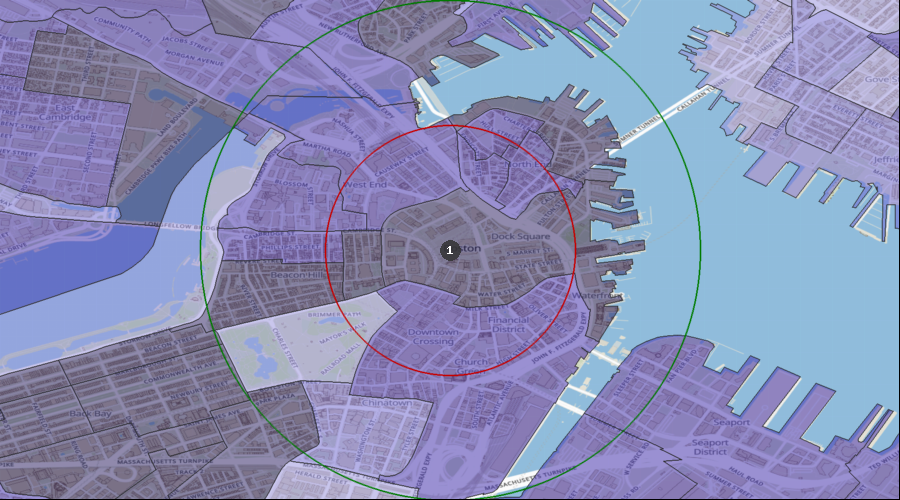
Visited a Dentist in Past 12 Months | 37.73% to 43.04% |
| 29.11% to 37.73% |
| 23.65% to 29.11% |
| 0.00% to 23.65% |
| 1. | Boston |
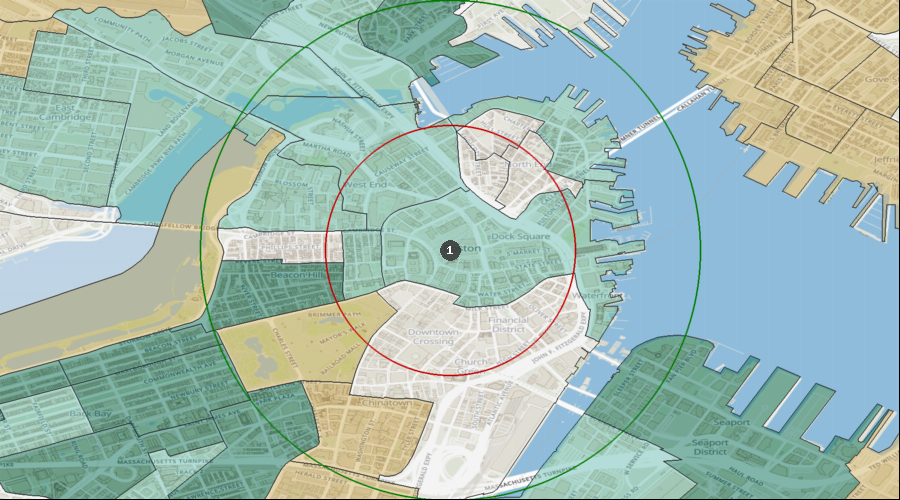
Percentage of the Population with a Bachelor's Degree
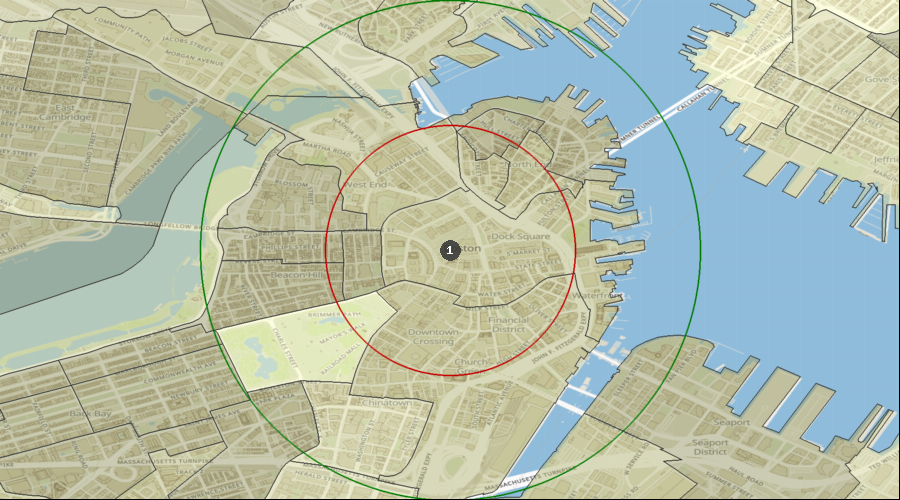
Education: Bach Deg by Census Tract | 78.98% to 96.72% |
| 62.34% to 78.98% |
| 42.93% to 62.34% |
| 22.80% to 42.93% |
| 0.00% to 22.80% |
| 1. | Boston |
Lifestyle Behaviors – Household Entertainment/Recreation Average Expenditure
Ent/Recreation Per HH (Avg by Census Tract) | $6,471 to $7,753 |
| $5,182 to $6,471 |
| $3,593 to $5,182 |
| $0 to $3,593 |
| 1. | Boston |
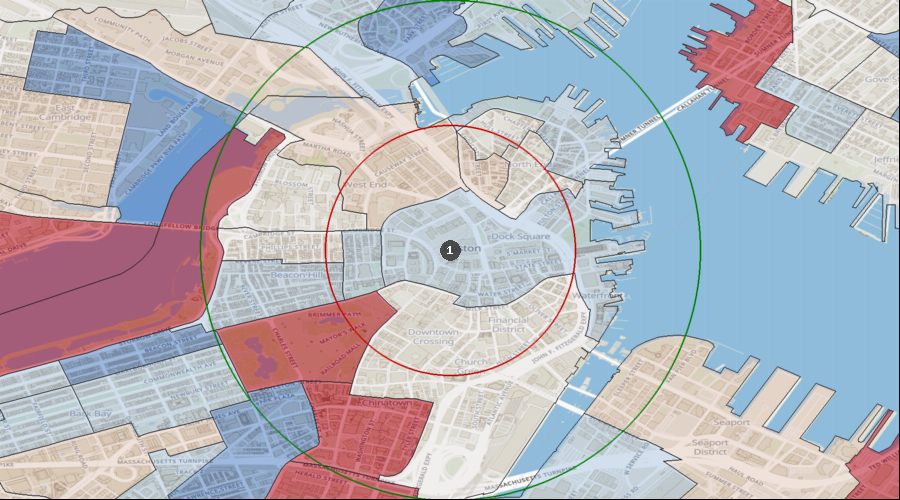
Projected Population Growth Rate
Projected Population Growth Per Year | 4.43% to 6.13% |
| 2.44% to 4.43% |
| 1.44% to 2.44% |
| 0.60% to 1.44% |
| 0.00% to 0.60% |
| 1. | Boston |
Average Household Expenditure for Health Insurance
Health Insurance Avg/HH by Census Tract | $6,847 to $8,204 |
| $5,307 to $6,847 |
| $3,569 to $5,307 |
| $0 to $3,569 |
| 1. | Boston |
Home Ownership Rates
Owner Occupied Households by Census Tract | 43.70% to 66.67% |
| 25.79% to 43.70% |
| 17.76% to 25.79% |
| 7.42% to 17.76% |
| 0.00% to 7.42% |
| 1. | Boston |
Median Household Income
Median Household Income by Census Tract | $131k to $159k |
| $105k to $131k |
| $66k to $105k |
| $24k to $66k |
| $0k to $24k |
| 1. | Boston |
Daily Average Traffic Count
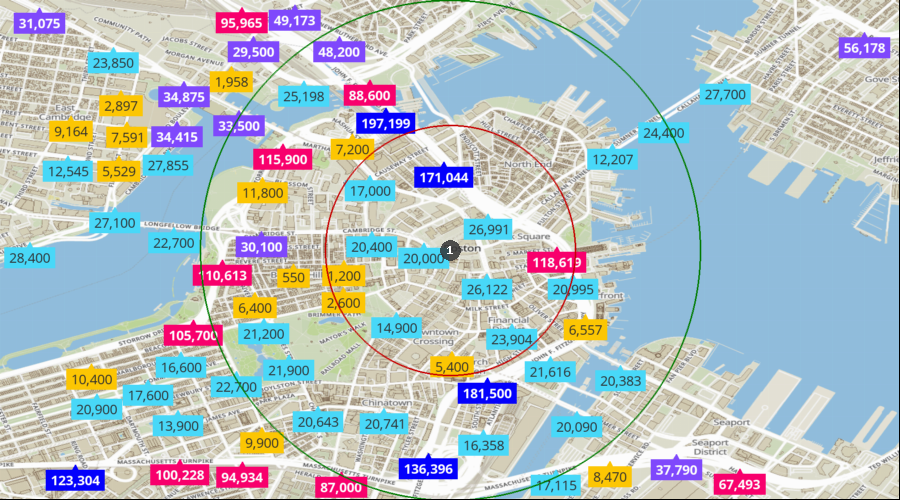
Traffic Counts | 123k to 197k |
| 67k to 123k |
| 29k to 67k |
| 12k to 29k |
| 0k to 12k |
| 1. | Boston |