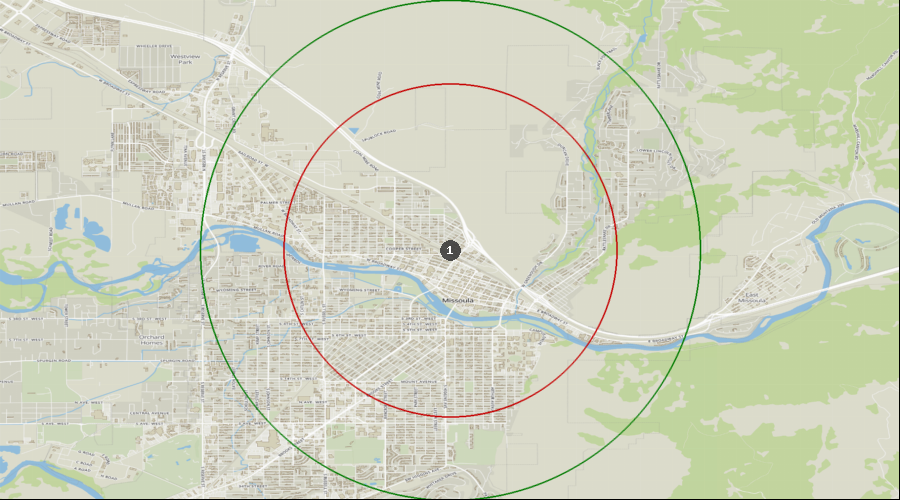
Missoula, Montana - Dental Demographics Maps
Want comprehensive data on dentist to population ratios?
A Denali Demographic Study looks at the information in demographic reports like historical data, market saturation, growth drivers, and dental specific statistics, and interprets all these dental demographics to provide a viability ranking that other demographic reports typically don’t provide.
Get a custom study for as little as $159
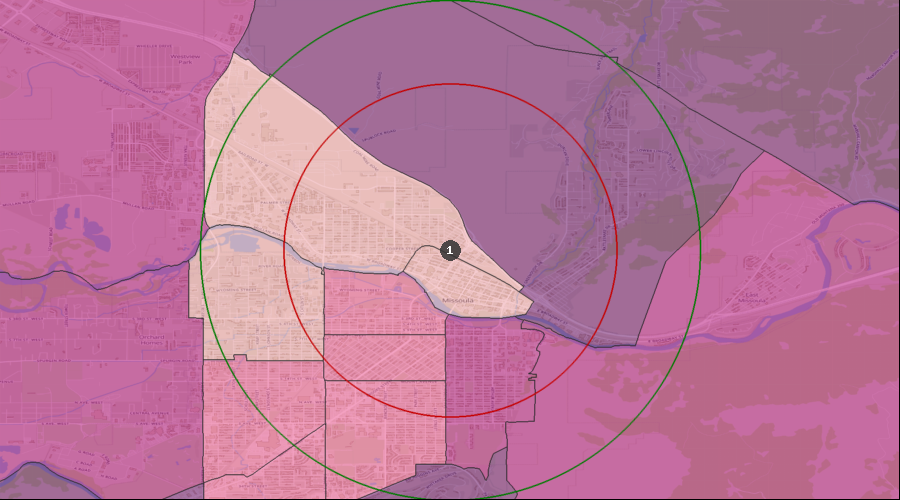
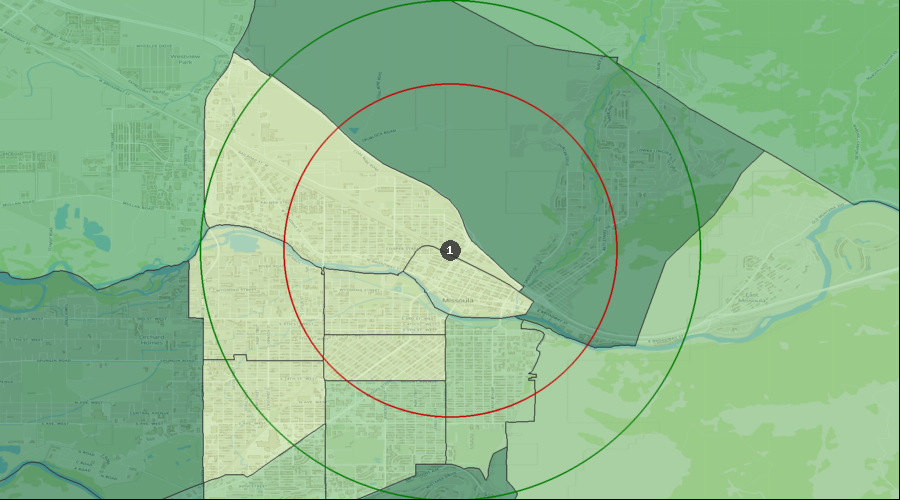
Average Dental Expenditures
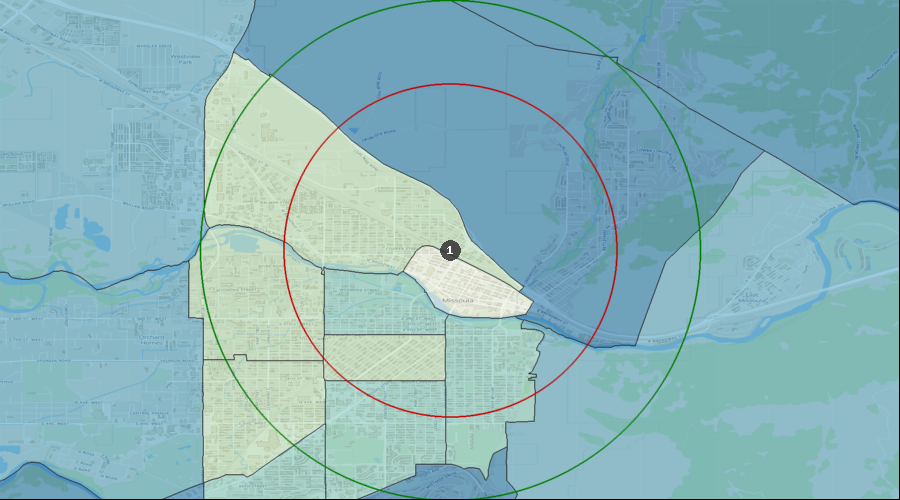
Dental Services per HH (Avg by Census Tract) | $386 to $550 |
| $308 to $386 |
| $243 to $308 |
| $183 to $243 |
| $139 to $183 |
| 1. | Missoula |
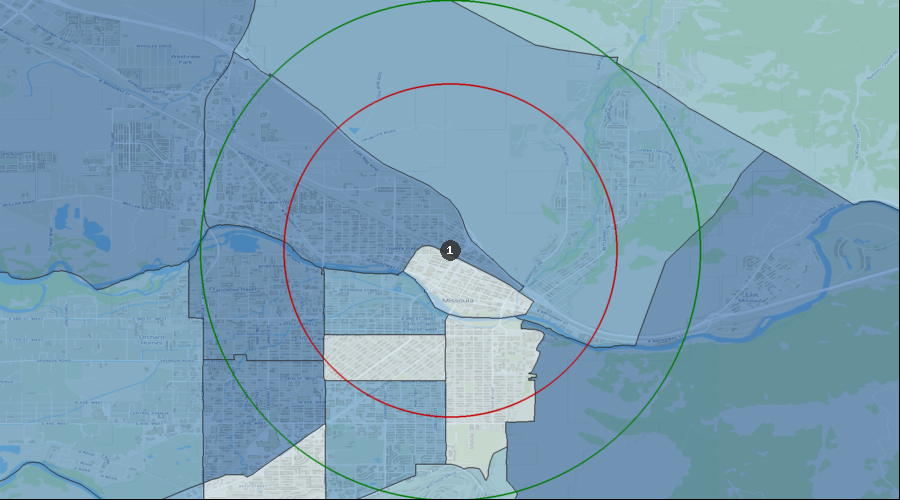
Percentage of the Population Visiting a Dentist in the Last 12 Months
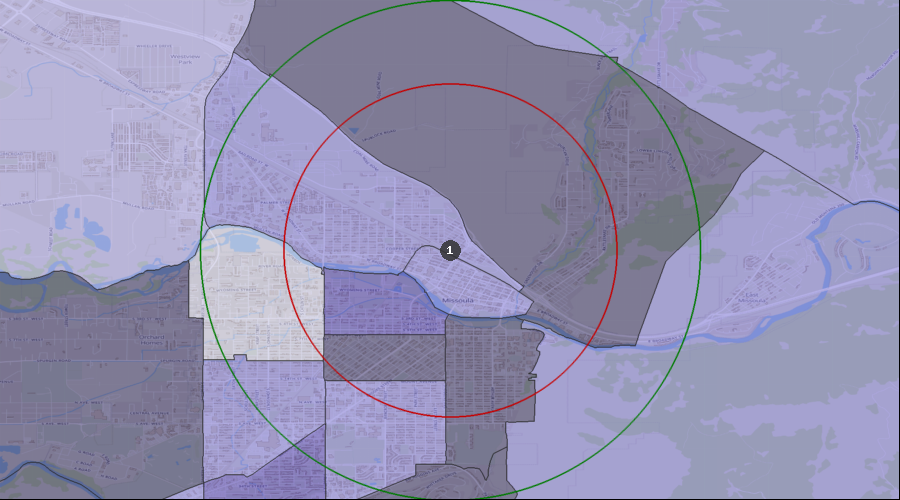
Visited a Dentist in Past 12 Months | 33.30% to 41.85% |
| 30.85% to 33.30% |
| 28.16% to 30.85% |
| 25.78% to 28.16% |
| 1. | Missoula |
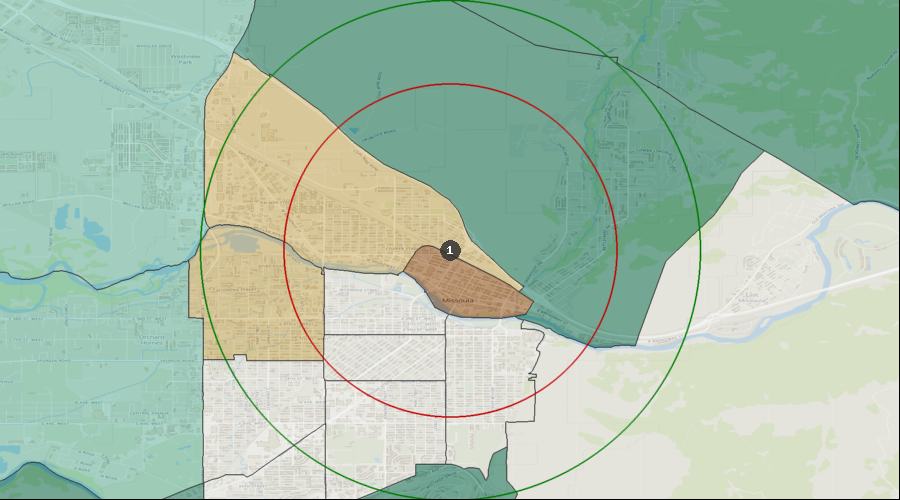
Percentage of the Population with a Bachelor's Degree
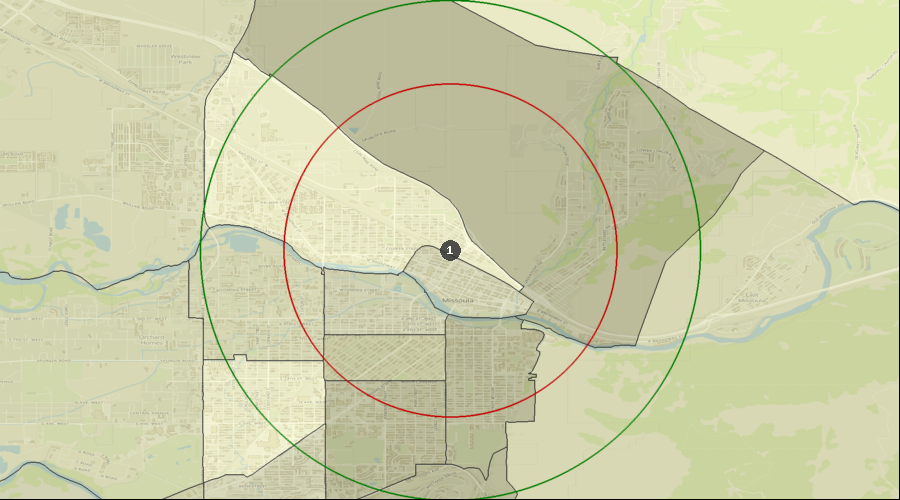
Education: Bach Deg by Census Tract | 58.46% to 69.37% |
| 51.89% to 58.46% |
| 42.22% to 51.89% |
| 35.89% to 42.22% |
| 33.49% to 35.89% |
| 1. | Missoula |
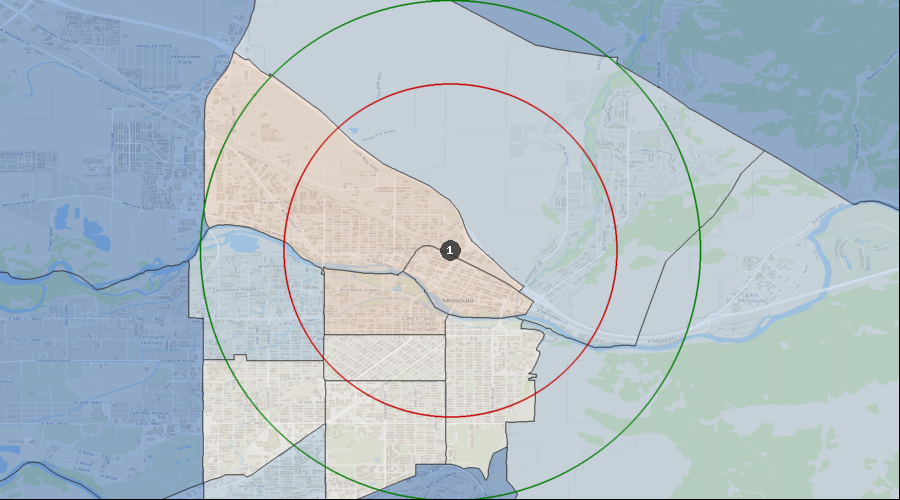
Lifestyle Behaviors – Household Entertainment/Recreation Average Expenditure
Ent/Recreation Per HH (Avg by Census Tract) | $3,074 to $4,392 |
| $2,487 to $3,074 |
| $1,847 to $2,487 |
| $1,243 to $1,847 |
| 1. | Missoula |
Projected Population Growth Rate
Projected Population Growth Per Year | 1.25% to 1.99% |
| 1.00% to 1.25% |
| 0.79% to 1.00% |
| 0.35% to 0.79% |
| 1. | Missoula |
Average Household Expenditure for Health Insurance
Health Insurance Avg/HH by Census Tract | $3,705 to $5,225 |
| $3,106 to $3,705 |
| $2,200 to $3,106 |
| $1,484 to $2,200 |
| 1. | Missoula |
Home Ownership Rates
Owner Occupied Households by Census Tract | 55.79% to 69.97% |
| 38.54% to 55.79% |
| 25.39% to 38.54% |
| 5.57% to 25.39% |
| 1. | Missoula |
Median Household Income
Median Household Income by Census Tract | $61k to $82k |
| $52k to $61k |
| $42k to $52k |
| $20k to $42k |
| 1. | Missoula |
Daily Average Traffic Count
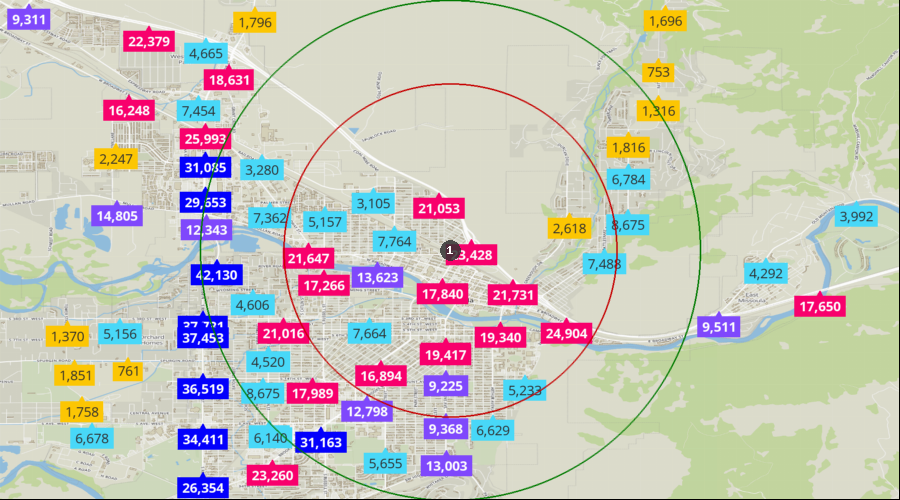
Traffic Counts | 26k to 42k |
| 16k to 26k |
| 9k to 16k |
| 3k to 9k |
| 0k to 3k |
| 1. | Missoula |