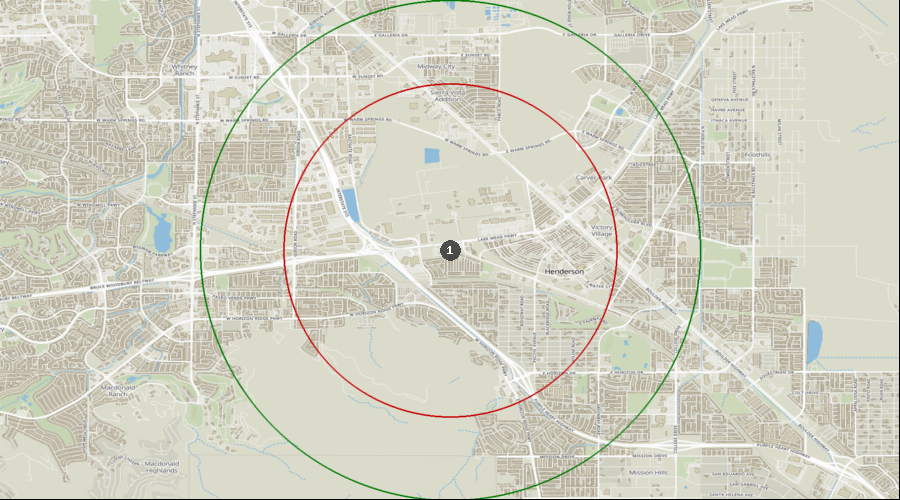
Henderson, Nevada - Dental Demographics Maps
Want comprehensive data on dentist to population ratios?
A Denali Demographic Study looks at the information in demographic reports like historical data, market saturation, growth drivers, and dental specific statistics, and interprets all these dental demographics to provide a viability ranking that other demographic reports typically don’t provide.
Get a custom study for as little as $159
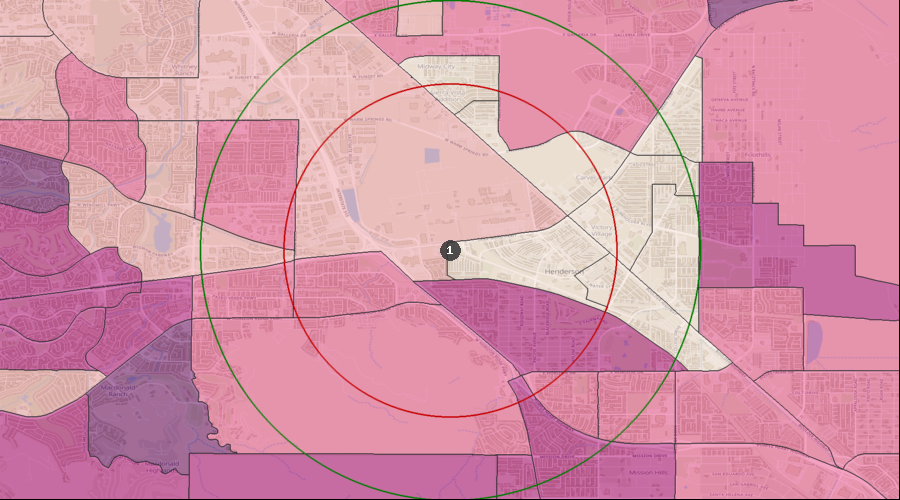
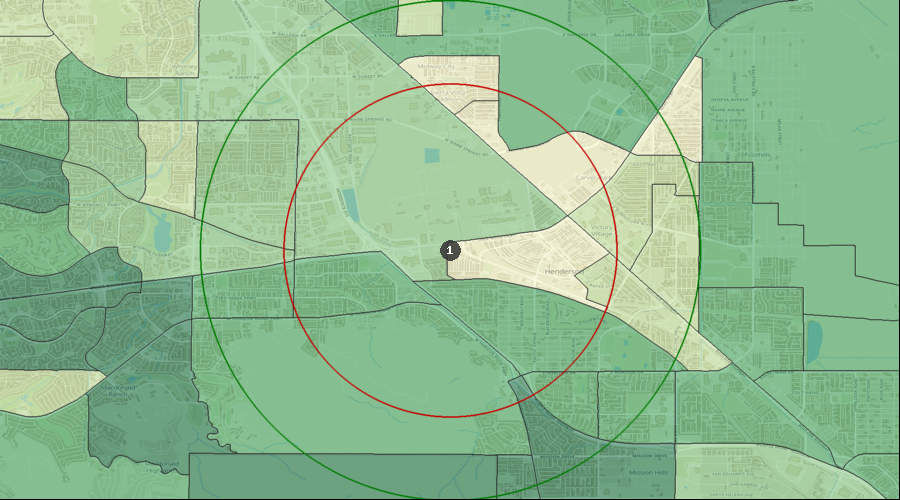
Average Dental Expenditures
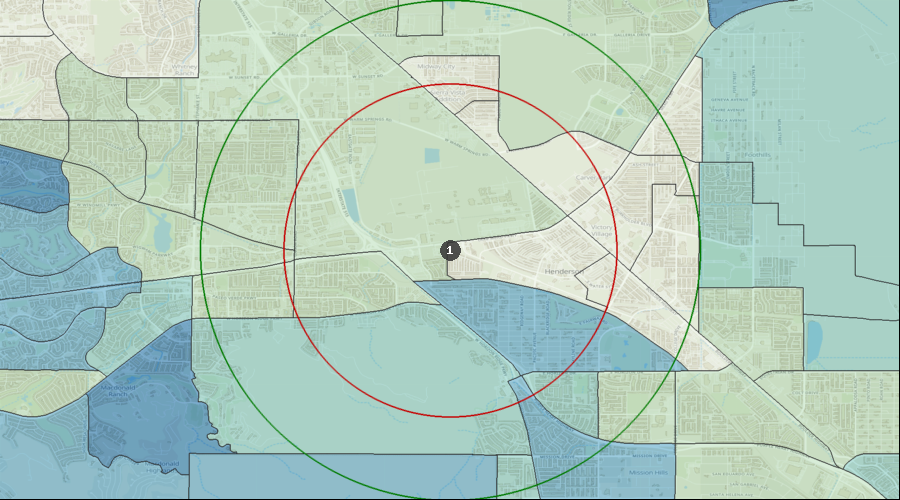
Dental Services per HH (Avg by Census Tract) | $616 to $805 |
| $498 to $616 |
| $407 to $498 |
| $289 to $407 |
| $188 to $289 |
| 1. | Henderson |
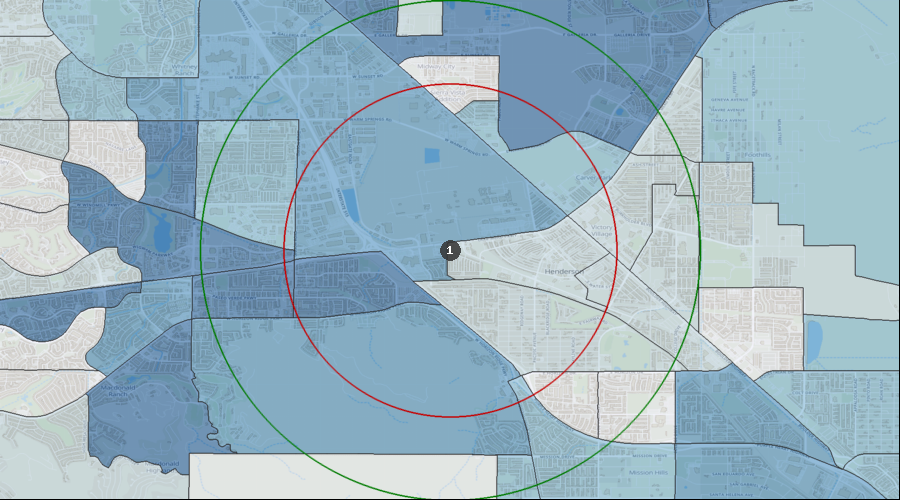
Percentage of the Population Visiting a Dentist in the Last 12 Months
Visited a Dentist in Past 12 Months | 36.09% to 57.91% |
| 30.30% to 36.09% |
| 26.44% to 30.30% |
| 22.95% to 26.44% |
| 20.74% to 22.95% |
| 1. | Henderson |
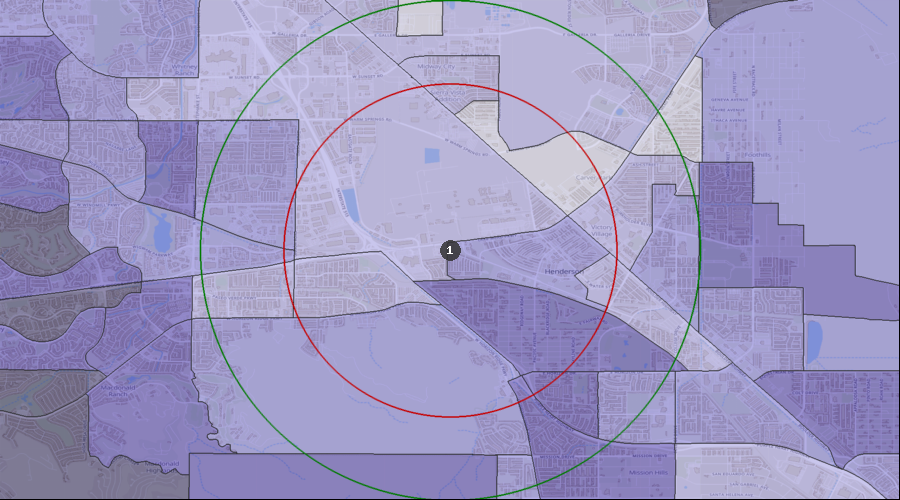
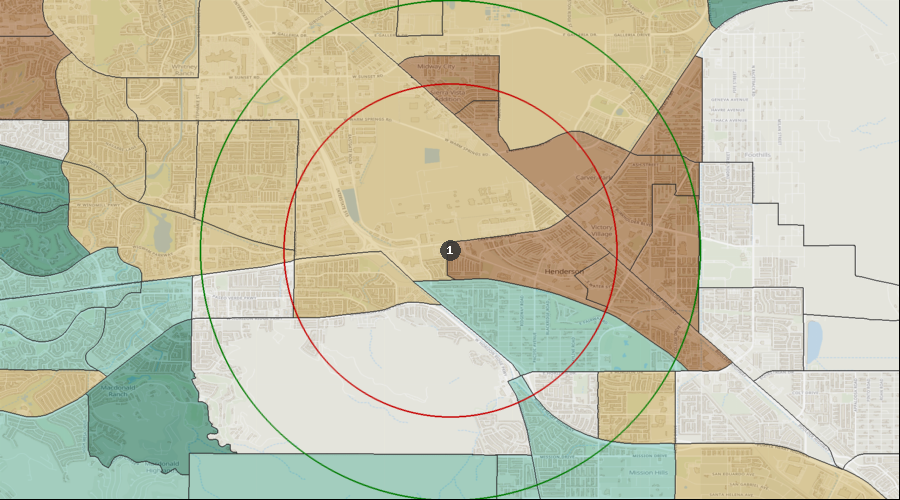
Percentage of the Population with a Bachelor's Degree
Education: Bach Deg by Census Tract | 40.10% to 52.04% |
| 32.41% to 40.10% |
| 24.19% to 32.41% |
| 14.47% to 24.19% |
| 8.34% to 14.47% |
| 1. | Henderson |
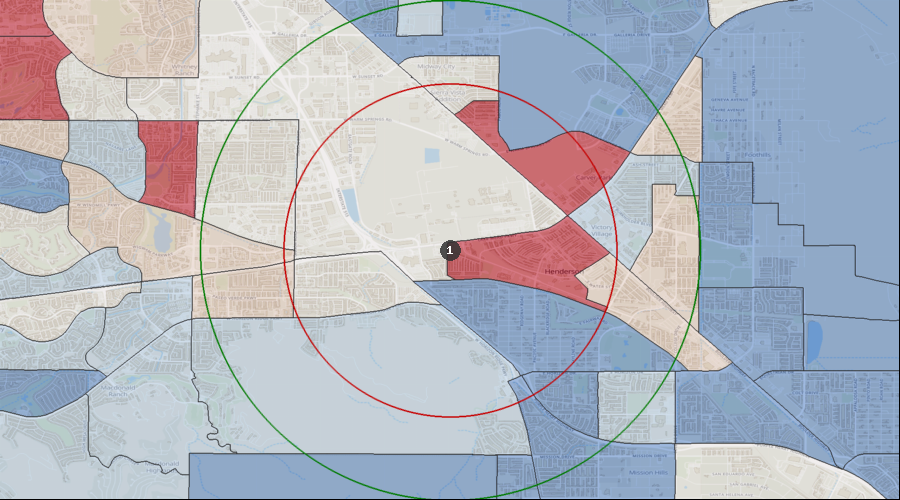
Lifestyle Behaviors – Household Entertainment/Recreation Average Expenditure
Ent/Recreation Per HH (Avg by Census Tract) | $4,728 to $6,406 |
| $3,824 to $4,728 |
| $3,027 to $3,824 |
| $2,220 to $3,027 |
| $1,641 to $2,220 |
| 1. | Henderson |
Projected Population Growth Rate
Projected Population Growth Per Year | 2.70% to 3.71% |
| 2.05% to 2.70% |
| 1.47% to 2.05% |
| 0.99% to 1.47% |
| 0.55% to 0.99% |
| 1. | Henderson |
Average Household Expenditure for Health Insurance
Health Insurance Avg/HH by Census Tract | $5,622 to $7,663 |
| $4,654 to $5,622 |
| $3,991 to $4,654 |
| $2,996 to $3,991 |
| $1,980 to $2,996 |
| 1. | Henderson |
Home Ownership Rates
Owner Occupied Households by Census Tract | 67.53% to 87.10% |
| 56.77% to 67.53% |
| 44.46% to 56.77% |
| 32.63% to 44.46% |
| 14.34% to 32.63% |
| 1. | Henderson |
Median Household Income
Median Household Income by Census Tract | $85k to $111k |
| $69k to $85k |
| $57k to $69k |
| $44k to $57k |
| $35k to $44k |
| 1. | Henderson |
Daily Average Traffic Count
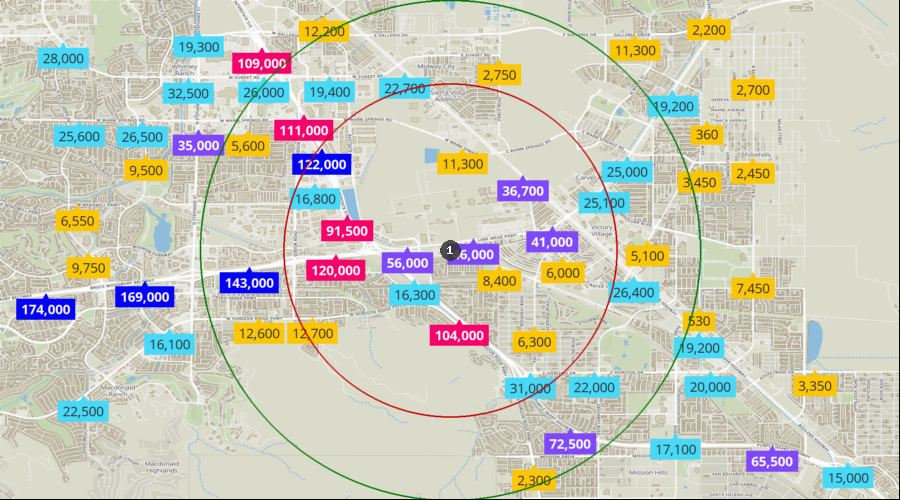
Traffic Counts | 122k to 174k |
| 73k to 122k |
| 35k to 73k |
| 14k to 35k |
| 0k to 14k |
| 1. | Henderson |