![]() | Population |
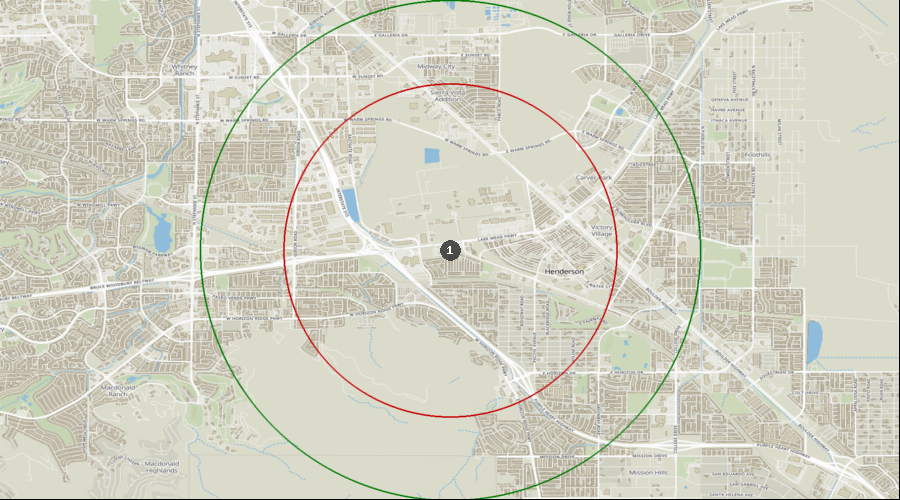
Henderson's current population is 34,712 people with 13,952 households within this smaller 2 mile radius. This area experienced positive population growth of 11.0% from 2010-2020. This area is projected to grow another 6.3% over the next five years. This is higher than the national average.
The median age of the population in this area is 40.3 which is slightly above the state average of 39.2 years old. This area has an average household size of 2.47 persons. This area is somewhat family centric with 60.5% of the households being family households and with 32.4% having children in the home and 16.8% of the population being under 15 and an additional 11.5% being under 24. Another 28.2% of this area’s population is between 25 and 44 years of age and 25.3% between 45-64 years old leaving 18.2% of the population over 65 years old. These last two age groups are target age groups for dentures, partials, crowns, and other restorative work.
Henderson has a daytime employee population of 24,019 versus a permanent population of 34,712 meaning the daytime employee population is 69.2% of the permanent population living in the area and 57.0% of the total daytime population. This is a significant daytime employee population that has a positive impact on the overall numbers.
| |
In this area, 31.2% of the population either holds a bachelor's degree or higher educational degree. Henderson is higher than the state and lower than US average.
The dominant racial and ethnic groups of the population in the Henderson area are White 58.8%, Black 8.1%, Native American 1.1%, Asian 7.1%, 9.6% other races and 24.3% Hispanic or Latino of any race.
Overall these population demographics are favorable indicators for an adult general practice dental office.
|  | Table #2 Significant Demographic Characteristics |
| |
Demographic Analysis for Henderson, Nevada
|
|
|
|
|
| POPULATION | | | |
| Population 2025 | | 34,712 | 3,265,907 | 338,440,954 |
| 2010 Total Population | | 29,201 | 2,707,834 | 309,121,785 |
| 2020 Total Population | | 32,421 | 3,112,590 | 331,839,624 |
| Projected Total Population 2030 | 36,882 | 3,392,820 | 344,873,411 |
| Population Change, 2010 - 2020 | 11.0% | 14.9% | 7.3% |
| Annual Population Change Rate, 2025 - 2030 | 1.2% | 0.8% | 0.4% |
| POPULATION AGE BREAKDOWN | | | |
| Median Age | 40.3 | 39.2 | 39.3 |
| Under 4 years old | 5.3% | 5.6% | 5.5% |
| 5 - 9 years old | 5.6% | 5.8% | 5.8% |
| 10 - 14 years old | 5.8% | 6.1% | 6.0% |
| 15 - 24 years old | 11.5% | 12.5% | 13.2% |
| 25 - 44 years old | 28.2% | 28.0% | 26.9% |
| Number of Adults 25-44 | 9,789 | 915,731 | 90,938,228 |
| 45 - 64 years old | 25.3% | 24.5% | 24.4% |
| Number of Adults 45-64 | 8,776 | 799,936 | 82,485,679 |
| 65 years and over | 18.2% | 17.5% | 18.1% |
| Number of Adults 65 years and older | 6,325 | 570,859 | 61,399,291 |
| 0 - 14 years old | 16.8% | 17.5% | 17.4% |
| Number of Children 0-14 years old | 5,825 | 571,529 | 58,800,947 |
NOTE: All percentages are rounded. ESRI data pulled as of August 26, 2025. Data showing future dates are projections.
| | Highlighted fields signify favorable characteristics on a comparison basis with the other locations listed and/or national averages |