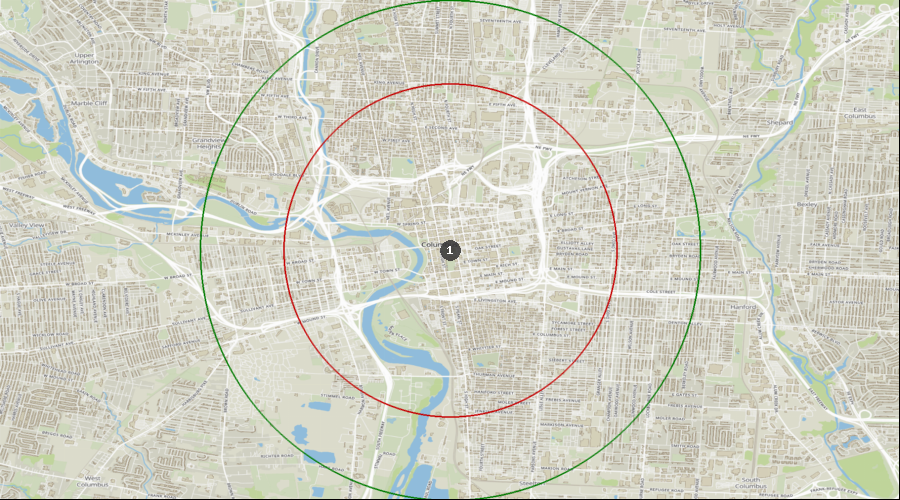
Columbus, Ohio - Dental Demographics
Want comprehensive data on dentist to population ratios?
A Denali Demographic Study looks at the information in demographic reports like historical data, market saturation, growth drivers, and dental specific statistics, and interprets all these dental demographics to provide a viability ranking that other demographic reports typically don’t provide.
Get a custom study for as little as $399
Columbus:
Overall the Columbus area contains the following set of demographics.
- The percentage of growth between 2010-2020 is 22.9%
- The projected population growth, 2021 to 2026, is 10.0%
- The median home value is $289,165
- The average housing cost as a percent of income 23.0%
- The percentage of the population with a bachelor's degree is 52.5%
- The number of new residents projected in the next 5 years is 7,047
- The number of daytime employees is 106,154
- The number of daytime residents is 30,448
- The dental spending is $339 (MPI 84)
- The percentage of the population visiting a dentist is 35.1% (MPI 93)
Population, 2021 | 70,600 | 11,839,300 * | 333,934,112 * |
Population >= 18 Years old | 82.0% | 79.1% * | 78.3% * |
Population < 18 Years old | 18.0% | 20.9% * | 21.7% * |
Projected Population, 2026 | 77,647 | 11,966,163 | 345,887,495 |
Median Age | 33.6 | 40.5 | 38.8 |
Projected population growth, 2021 to 2026 | 10.0% | 1.1% | 3.6% |
New Projected Residents Added in the Next 5 Years (2021-2026) | 7,047 | 126,863 | 11,953,383 |
New Projected Households Added in the Next 5 Years (2021-2026) | 3,868 | 61,526 | 4,576,689 |
* | There may be a slight difference between the population numbers and the percentage breakdown noted in the location table above compared with the US Census data. The data above is from ESRI, a more frequently updated source. |