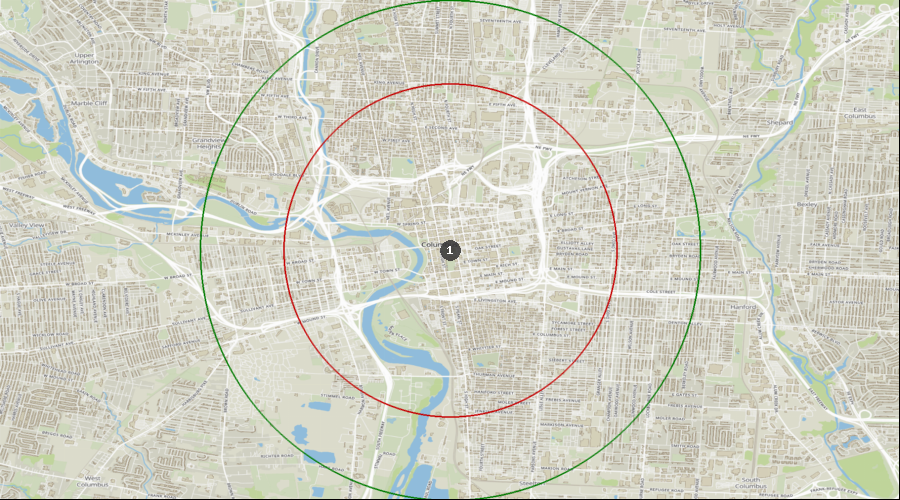
Columbus, Ohio - Dental Demographics Maps
Want comprehensive data on dentist to population ratios?
A Denali Demographic Study looks at the information in demographic reports like historical data, market saturation, growth drivers, and dental specific statistics, and interprets all these dental demographics to provide a viability ranking that other demographic reports typically don’t provide.
Get a custom study for as little as $159
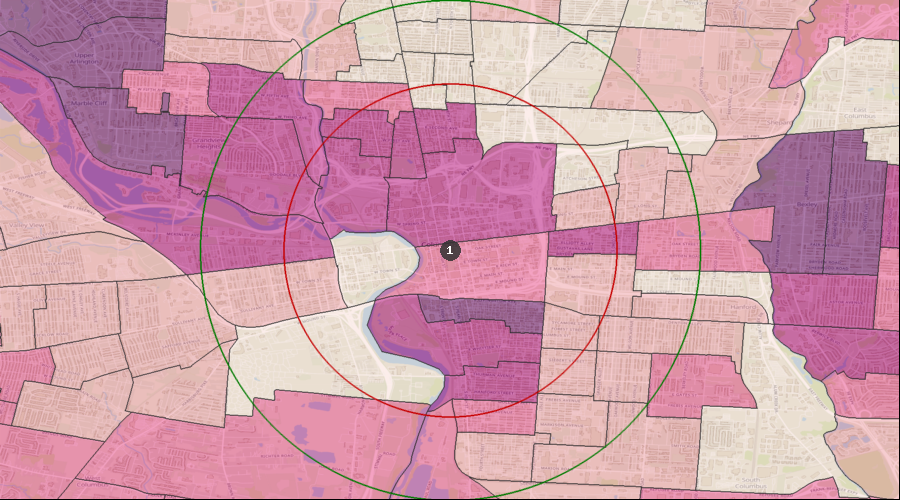
Average Dental Expenditures
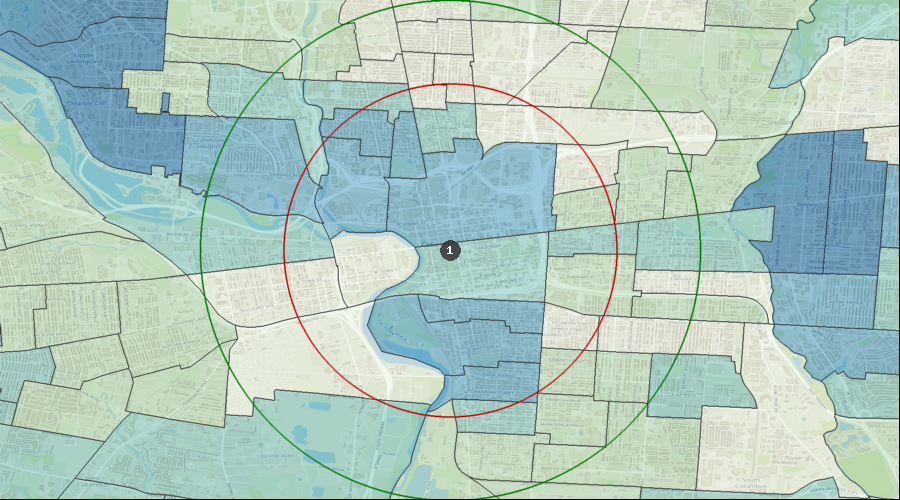
Dental Services per HH (Avg by Census Tract) | $461 to $946 |
| $339 to $461 |
| $232 to $339 |
| $155 to $232 |
| $66 to $155 |
| 1. | Columbus |
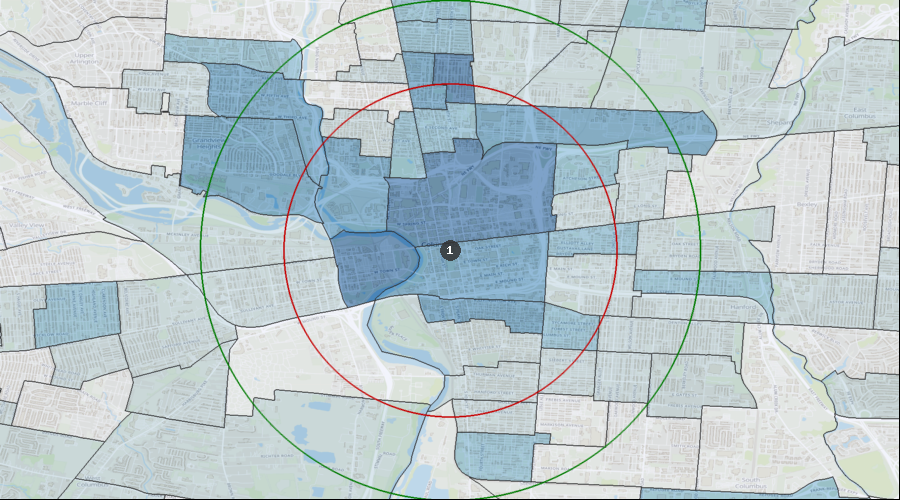
Percentage of the Population Visiting a Dentist in the Last 12 Months
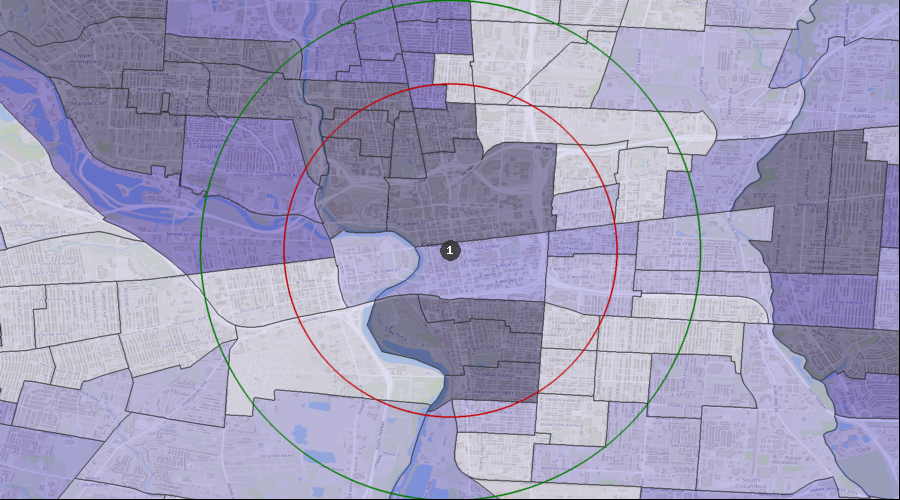
Visited a Dentist in Past 12 Months | 34.89% to 39.54% |
| 29.80% to 34.89% |
| 24.64% to 29.80% |
| 20.88% to 24.64% |
| 17.05% to 20.88% |
| 1. | Columbus |
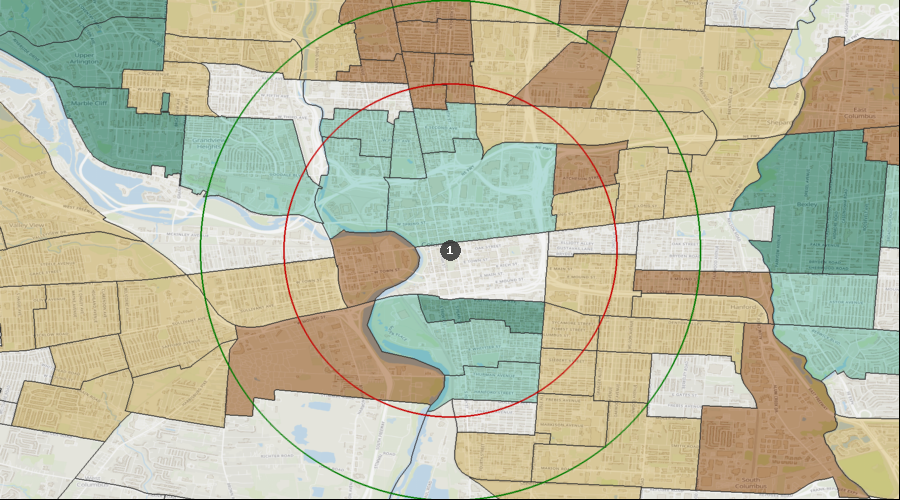
Percentage of the Population with a Bachelor's Degree
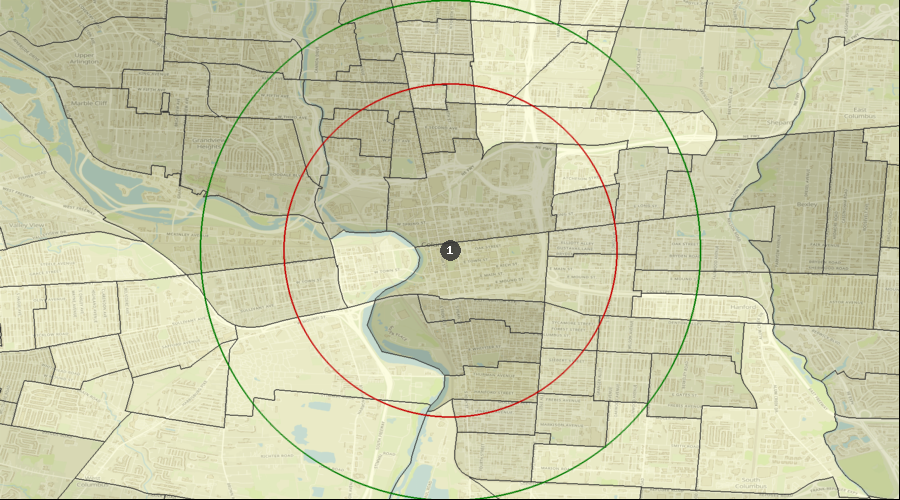
Education: Bach Deg by Census Tract | 68.16% to 85.18% |
| 48.52% to 68.16% |
| 22.84% to 48.52% |
| 10.71% to 22.84% |
| 1.39% to 10.71% |
| 1. | Columbus |
Lifestyle Behaviors – Household Entertainment/Recreation Average Expenditure
Ent/Recreation Per HH (Avg by Census Tract) | $4,292 to $7,712 |
| $2,875 to $4,292 |
| $2,019 to $2,875 |
| $1,362 to $2,019 |
| $666 to $1,362 |
| 1. | Columbus |
Projected Population Growth Rate
Projected Population Growth Per Year | 3.05% to 6.45% |
| 1.84% to 3.05% |
| 1.13% to 1.84% |
| 0.65% to 1.13% |
| -0.12% to 0.65% |
| 1. | Columbus |
Average Household Expenditure for Health Insurance
Health Insurance Avg/HH by Census Tract | $4,735 to $8,703 |
| $3,559 to $4,735 |
| $2,512 to $3,559 |
| $1,635 to $2,512 |
| $723 to $1,635 |
| 1. | Columbus |
Home Ownership Rates
Owner Occupied Households by Census Tract | 63.90% to 81.01% |
| 46.52% to 63.90% |
| 27.14% to 46.52% |
| 13.54% to 27.14% |
| 0.00% to 13.54% |
| 1. | Columbus |
Median Household Income
Median Household Income by Census Tract | $88k to $148k |
| $65k to $88k |
| $45k to $65k |
| $28k to $45k |
| $11k to $28k |
| 1. | Columbus |
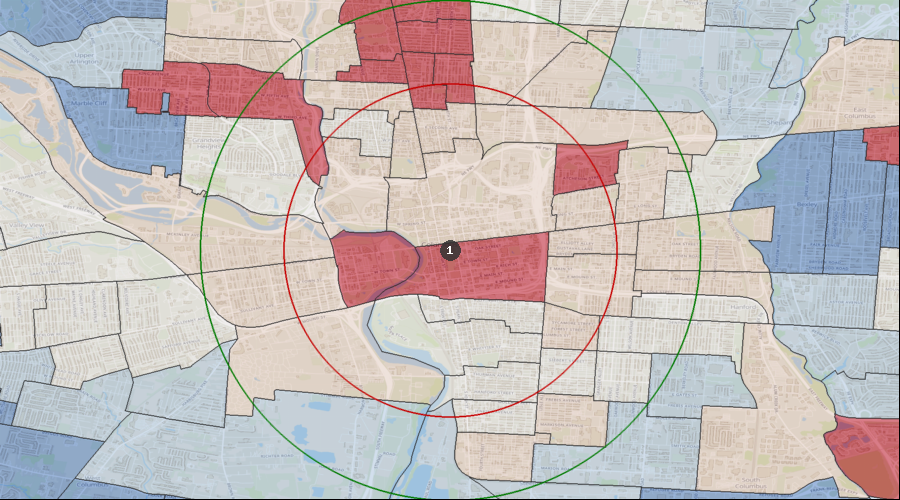
Daily Average Traffic Count
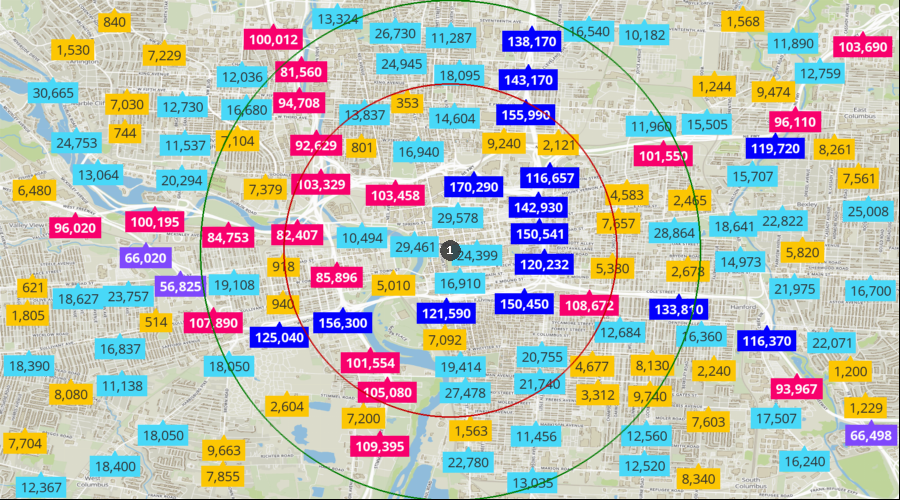
Traffic Counts | 111k to 170k |
| 68k to 111k |
| 34k to 68k |
| 10k to 34k |
| 0k to 10k |
| 1. | Columbus |