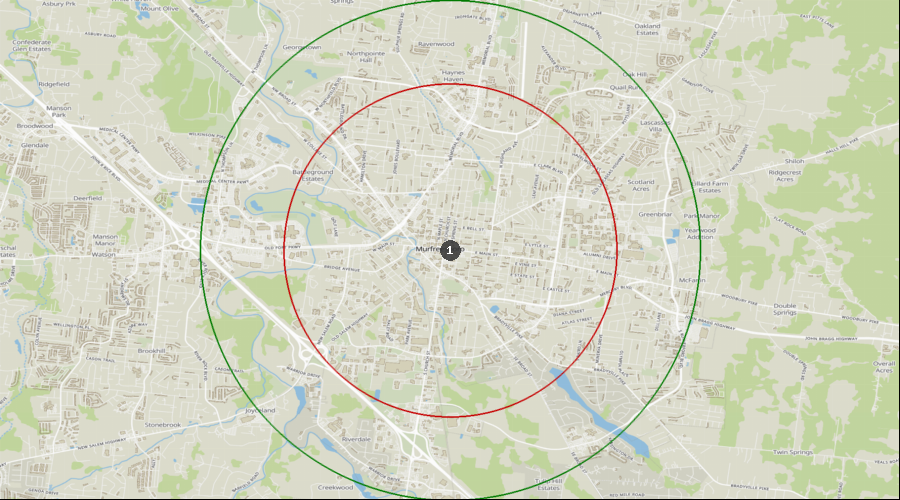
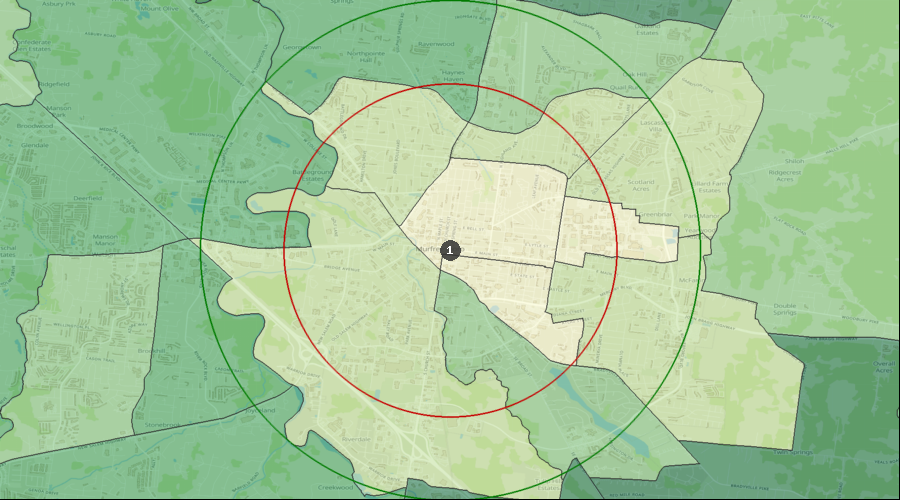
Murfreesboro, Tennessee - Dental Demographics Maps
Want comprehensive data on dentist to population ratios?
A Denali Demographic Study looks at the information in demographic reports like historical data, market saturation, growth drivers, and dental specific statistics, and interprets all these dental demographics to provide a viability ranking that other demographic reports typically don’t provide.
Get a custom study for as little as $159
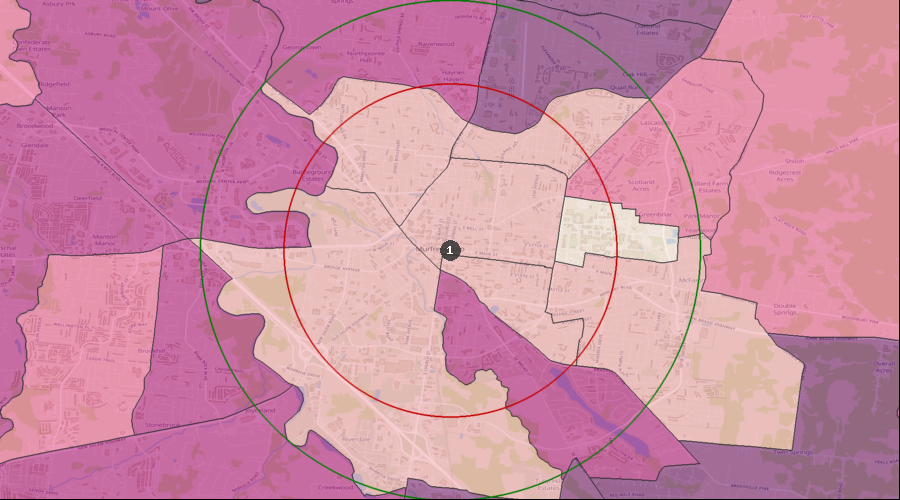
Average Dental Expenditures
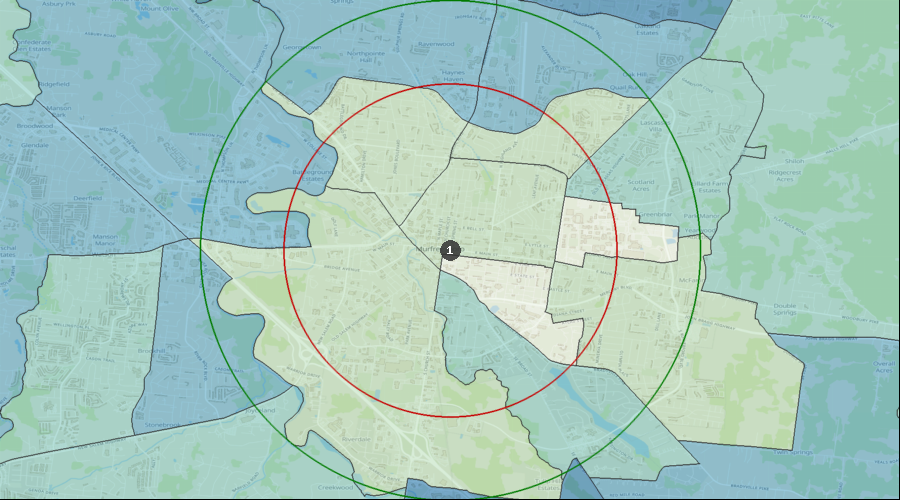
Dental Services per HH (Avg by Census Tract) | $404 to $575 |
| $357 to $404 |
| $263 to $357 |
| $160 to $263 |
| $85 to $160 |
| 1. | Murfreesboro |
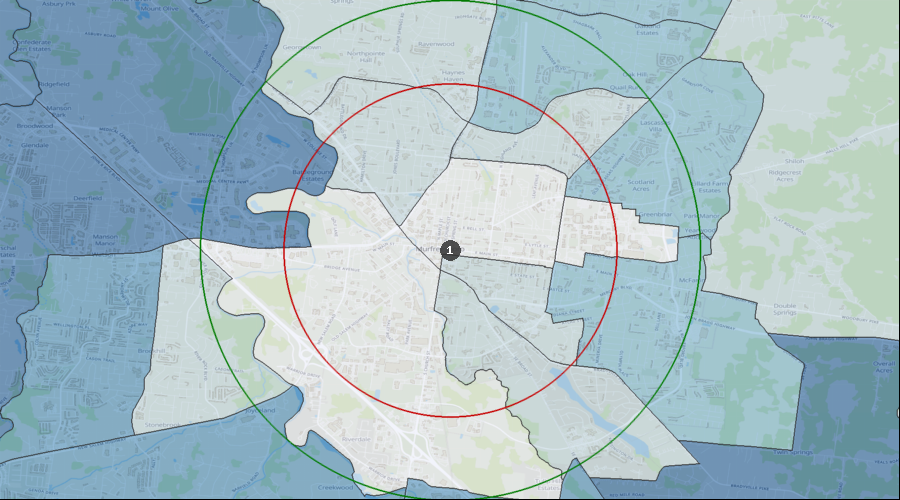
Percentage of the Population Visiting a Dentist in the Last 12 Months
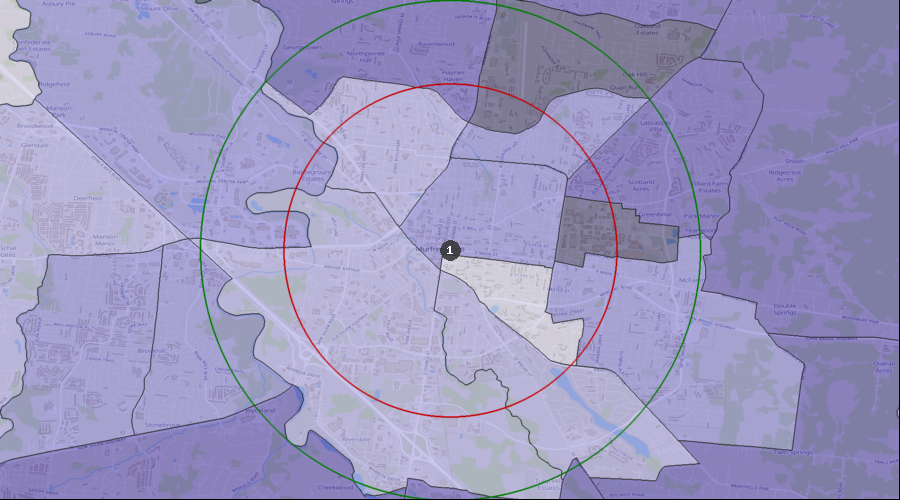
Visited a Dentist in Past 12 Months | 31.54% to 40.12% |
| 28.81% to 31.54% |
| 25.11% to 28.81% |
| 23.29% to 25.11% |
| 22.79% to 23.29% |
| 1. | Murfreesboro |
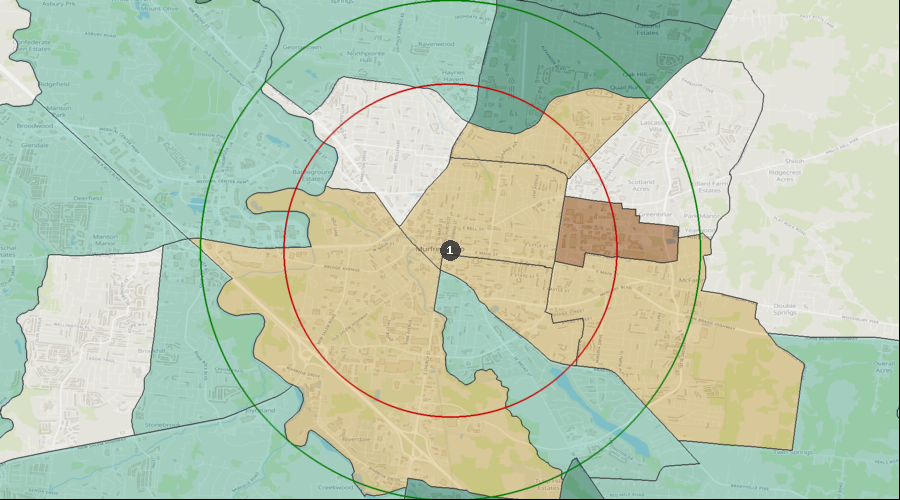
Percentage of the Population with a Bachelor's Degree
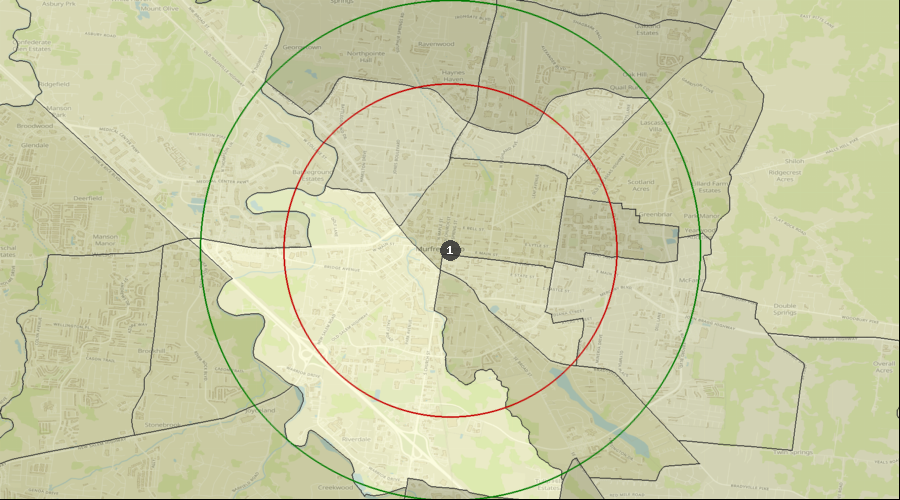
Education: Bach Deg by Census Tract | 44.27% to 62.02% |
| 33.14% to 44.27% |
| 26.99% to 33.14% |
| 14.31% to 26.99% |
| 1. | Murfreesboro |
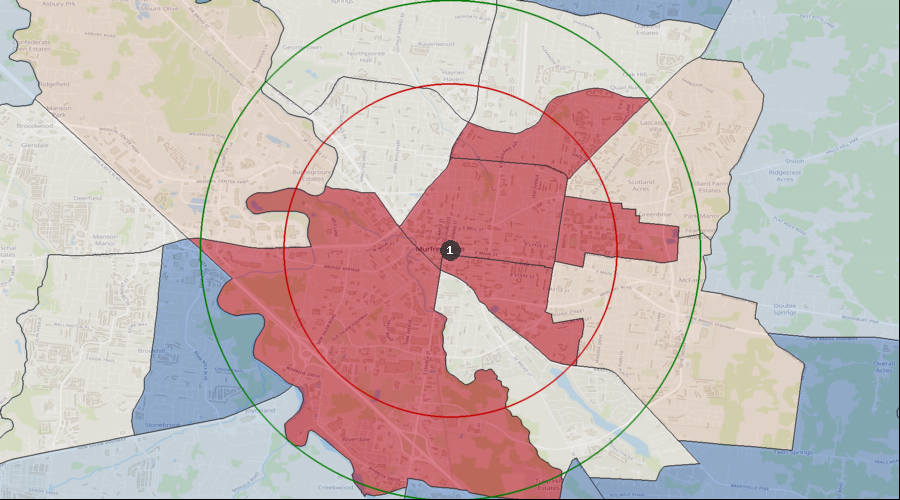
Lifestyle Behaviors – Household Entertainment/Recreation Average Expenditure
Ent/Recreation Per HH (Avg by Census Tract) | $3,646 to $5,390 |
| $2,974 to $3,646 |
| $2,265 to $2,974 |
| $1,417 to $2,265 |
| $940 to $1,417 |
| 1. | Murfreesboro |
Projected Population Growth Rate
Projected Population Growth Per Year | 2.91% to 4.75% |
| 2.36% to 2.91% |
| 1.56% to 2.36% |
| 0.64% to 1.56% |
| 0.02% to 0.64% |
| 1. | Murfreesboro |
Average Household Expenditure for Health Insurance
Health Insurance Avg/HH by Census Tract | $4,603 to $6,334 |
| $3,683 to $4,603 |
| $2,761 to $3,683 |
| $1,713 to $2,761 |
| $1,020 to $1,713 |
| 1. | Murfreesboro |
Home Ownership Rates
Owner Occupied Households by Census Tract | 75.16% to 90.97% |
| 62.36% to 75.16% |
| 37.06% to 62.36% |
| 20.36% to 37.06% |
| 2.94% to 20.36% |
| 1. | Murfreesboro |
Median Household Income
Median Household Income by Census Tract | $84k to $114k |
| $69k to $84k |
| $53k to $69k |
| $35k to $53k |
| $16k to $35k |
| 1. | Murfreesboro |
Daily Average Traffic Count
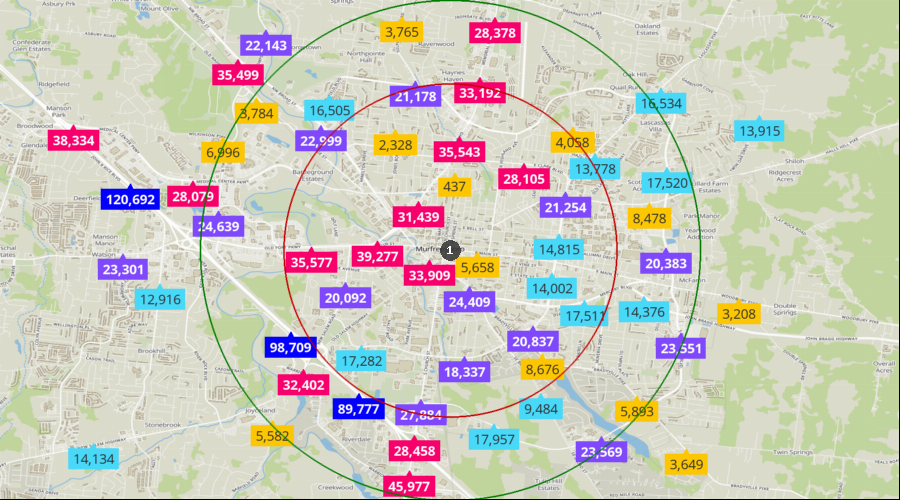
Traffic Counts | 46k to 121k |
| 28k to 46k |
| 18k to 28k |
| 9k to 18k |
| 0k to 9k |
| 1. | Murfreesboro |