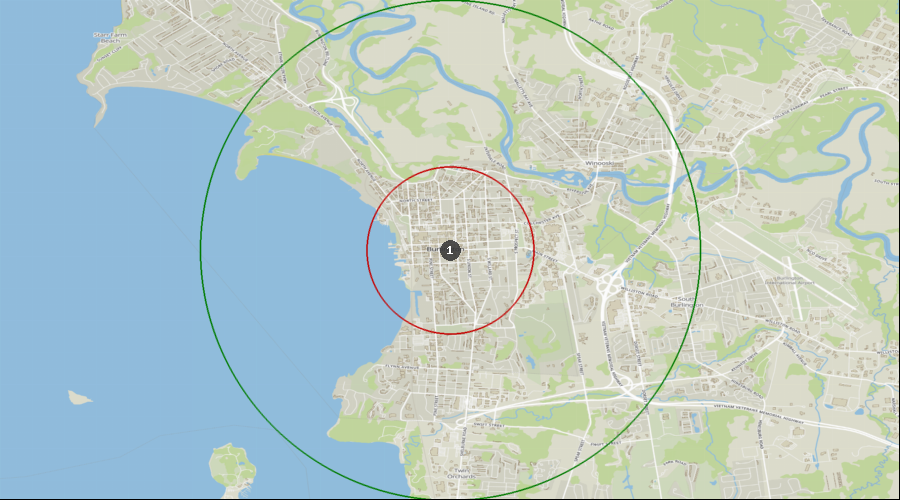
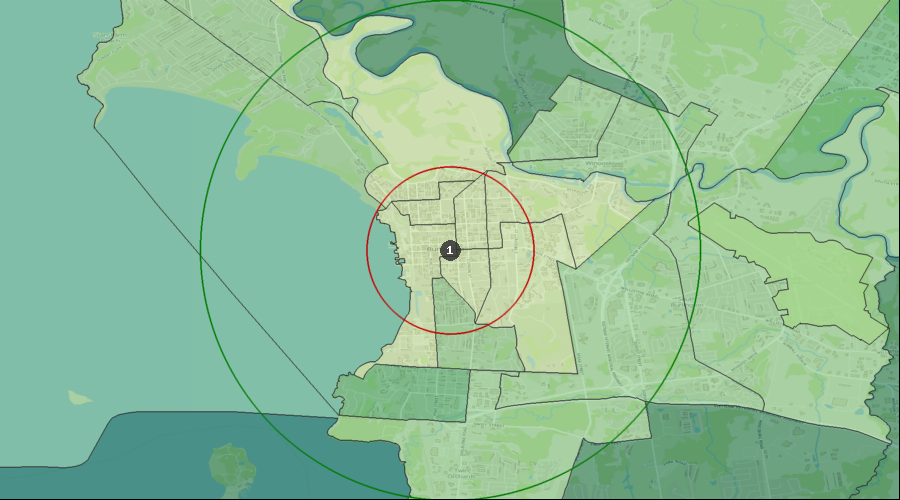
Burlington, Vermont - Dental Demographics Maps
Want comprehensive data on dentist to population ratios?
A Denali Demographic Study looks at the information in demographic reports like historical data, market saturation, growth drivers, and dental specific statistics, and interprets all these dental demographics to provide a viability ranking that other demographic reports typically don’t provide.
Get a custom study for as little as $159
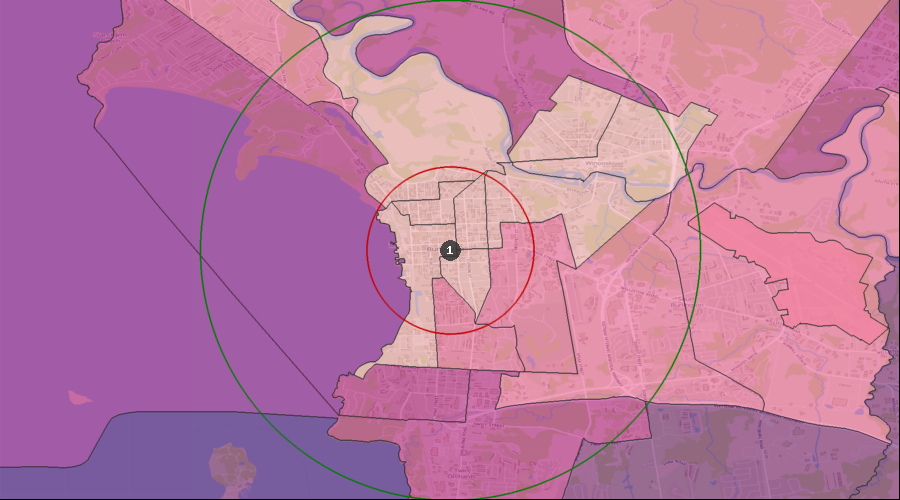
Average Dental Expenditures
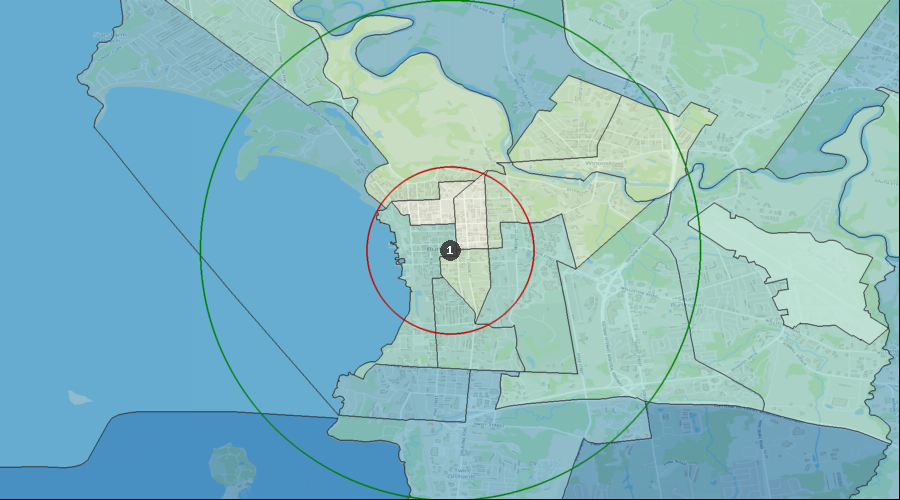
Dental Services per HH (Avg by Census Tract) | $491 to $676 |
| $375 to $491 |
| $288 to $375 |
| $161 to $288 |
| $0 to $161 |
| 1. | Burlington |
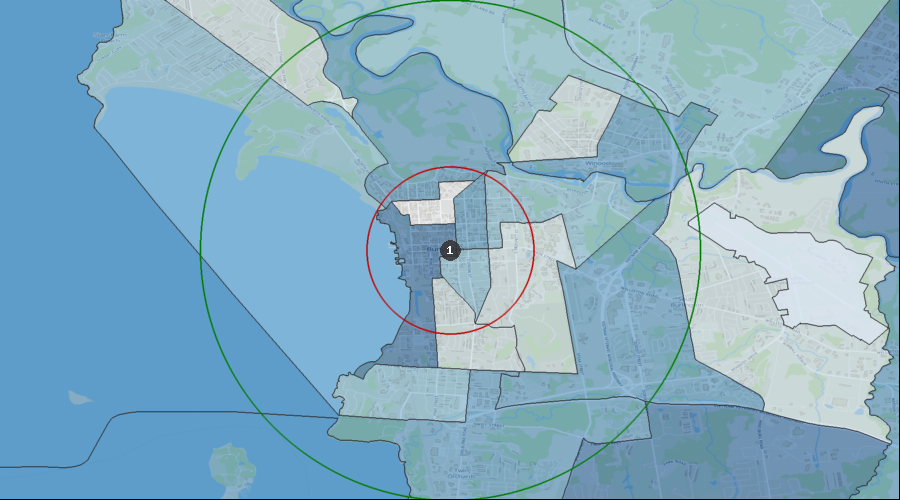
Percentage of the Population Visiting a Dentist in the Last 12 Months
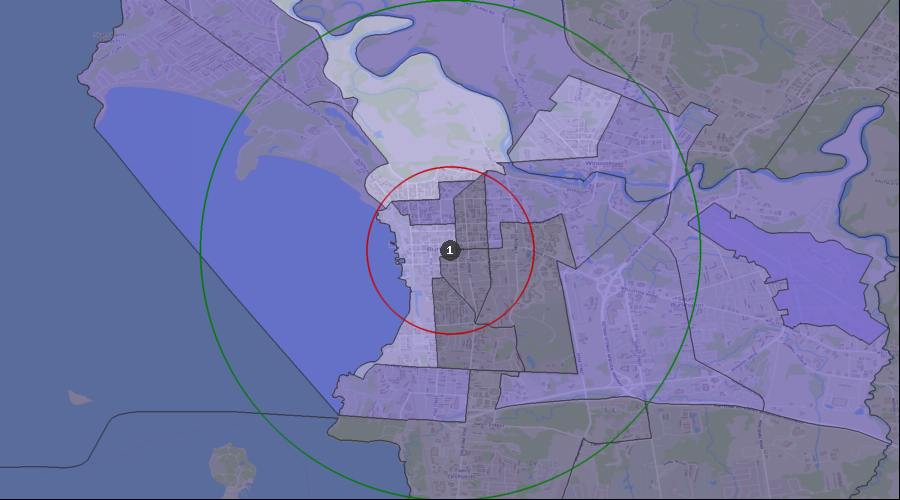
Visited a Dentist in Past 12 Months | 34.22% to 39.96% |
| 30.50% to 34.22% |
| 23.78% to 30.50% |
| 0.00% to 23.78% |
| 1. | Burlington |
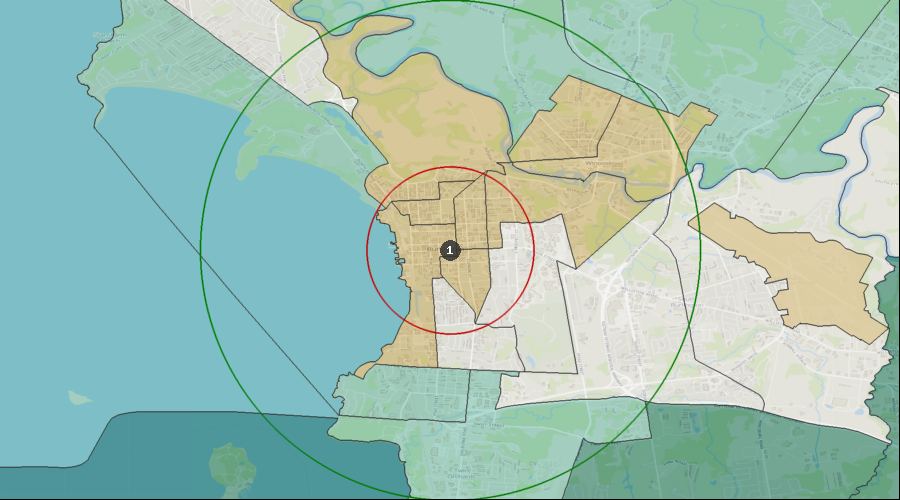
Percentage of the Population with a Bachelor's Degree
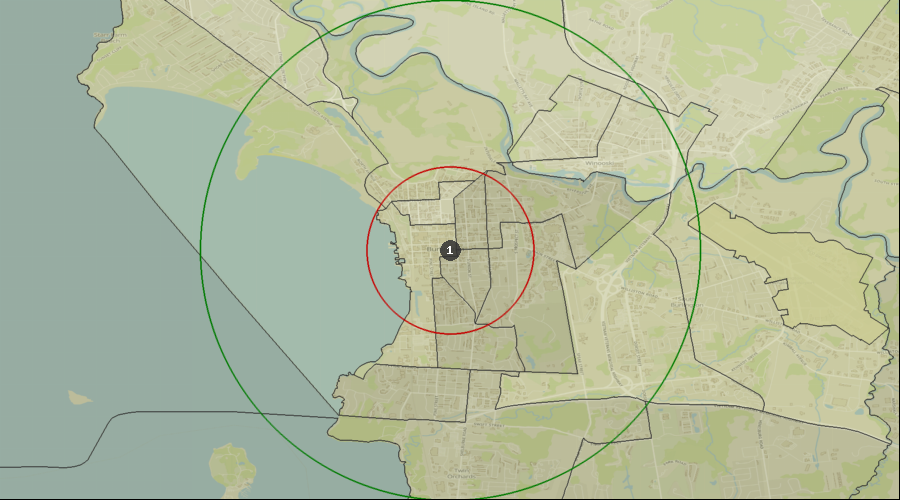
Education: Bach Deg by Census Tract | 55.62% to 77.32% |
| 43.66% to 55.62% |
| 26.30% to 43.66% |
| 0.00% to 26.30% |
| 1. | Burlington |
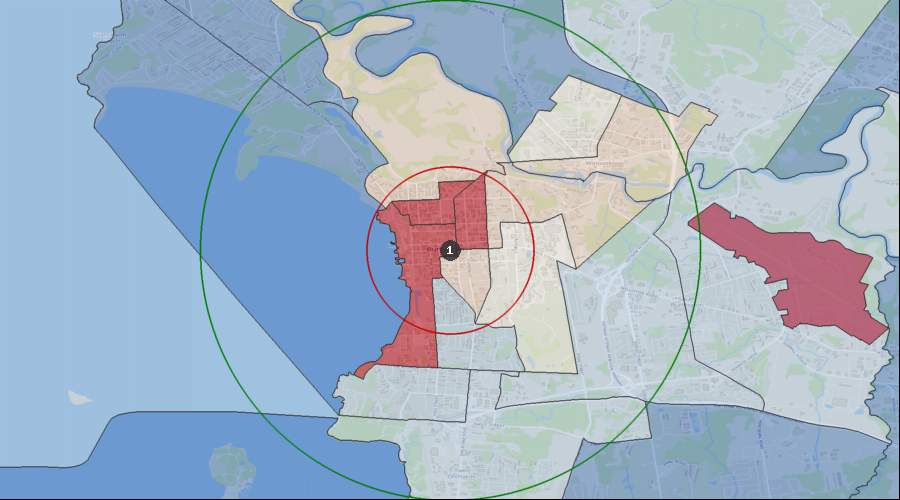
Lifestyle Behaviors – Household Entertainment/Recreation Average Expenditure
Ent/Recreation Per HH (Avg by Census Tract) | $4,160 to $6,238 |
| $3,174 to $4,160 |
| $2,435 to $3,174 |
| $0 to $2,435 |
| 1. | Burlington |
Projected Population Growth Rate
Projected Population Growth Per Year | 1.01% to 3.62% |
| 0.64% to 1.01% |
| 0.29% to 0.64% |
| 0.07% to 0.29% |
| 0.00% to 0.07% |
| 1. | Burlington |
Average Household Expenditure for Health Insurance
Health Insurance Avg/HH by Census Tract | $5,016 to $7,155 |
| $3,721 to $5,016 |
| $2,845 to $3,721 |
| $0 to $2,845 |
| 1. | Burlington |
Home Ownership Rates
Owner Occupied Households by Census Tract | 56.02% to 87.71% |
| 43.14% to 56.02% |
| 26.30% to 43.14% |
| 14.93% to 26.30% |
| 0.00% to 14.93% |
| 1. | Burlington |
Median Household Income
Median Household Income by Census Tract | $83k to $130k |
| $67k to $83k |
| $40k to $67k |
| $0k to $40k |
| 1. | Burlington |
Daily Average Traffic Count
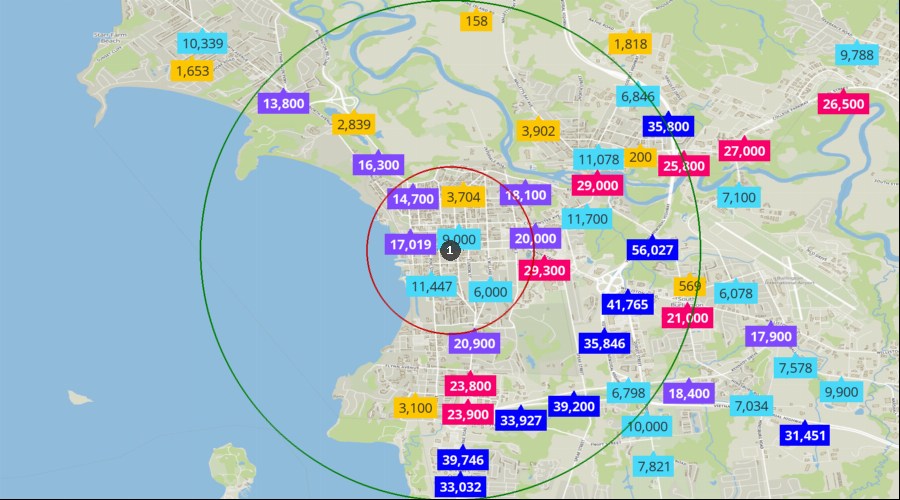
Traffic Counts | 31k to 56k |
| 21k to 31k |
| 12k to 21k |
| 5k to 12k |
| 0k to 5k |
| 1. | Burlington |