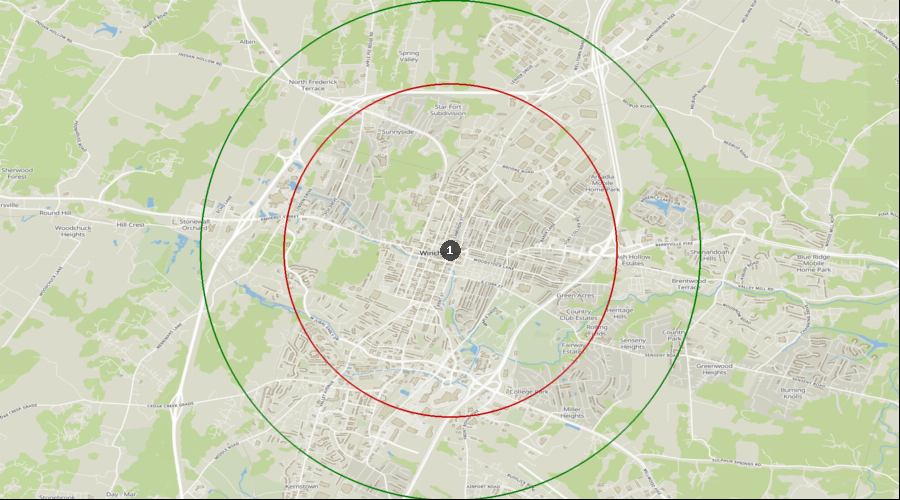
Winchester, Virginia - Dental Demographics Maps
Want comprehensive data on dentist to population ratios?
A Denali Demographic Study looks at the information in demographic reports like historical data, market saturation, growth drivers, and dental specific statistics, and interprets all these dental demographics to provide a viability ranking that other demographic reports typically don’t provide.
Get a custom study for as little as $159
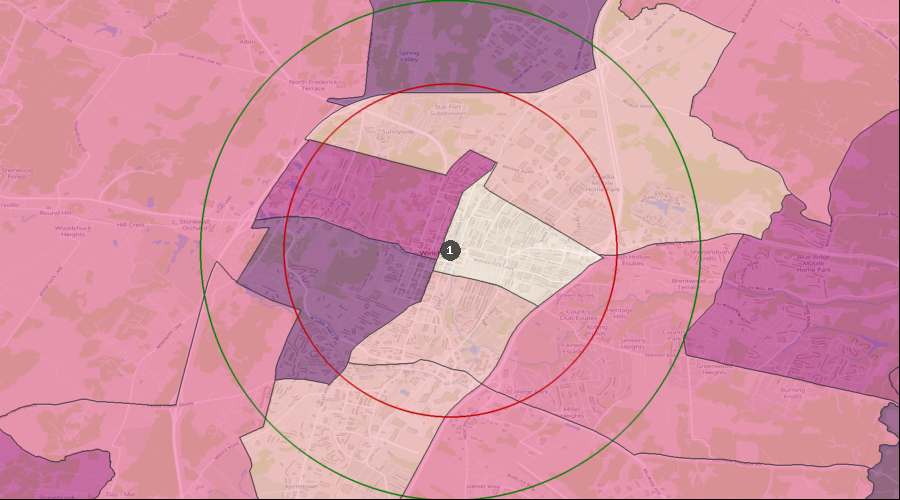
Average Dental Expenditures
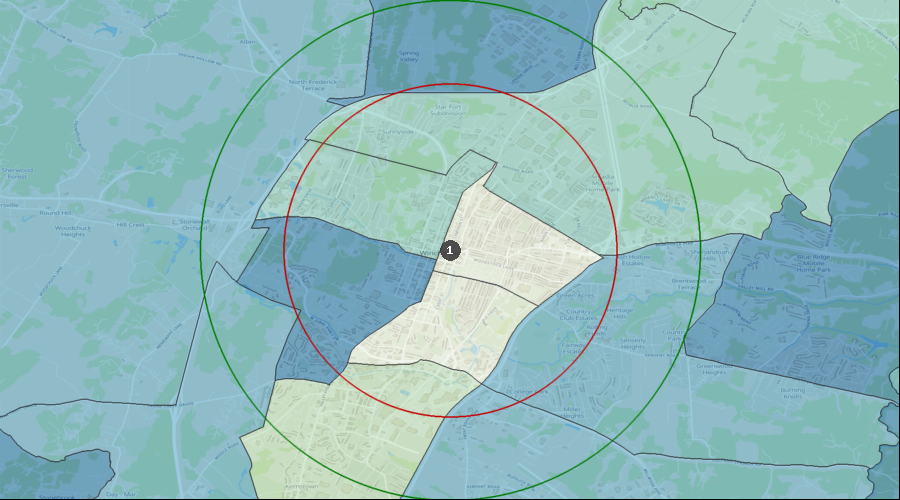
Dental Services per HH (Avg by Census Tract) | $466 to $680 |
| $416 to $466 |
| $281 to $416 |
| $244 to $281 |
| $216 to $244 |
| 1. | Winchester |
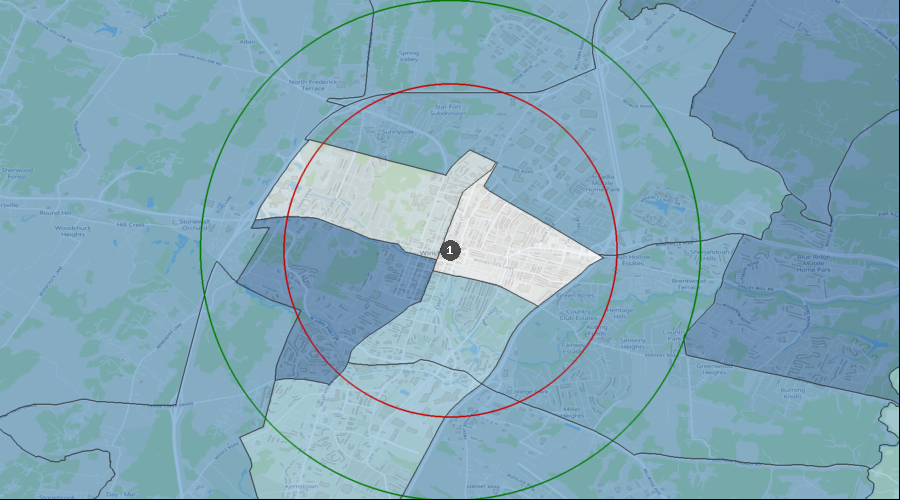
Percentage of the Population Visiting a Dentist in the Last 12 Months
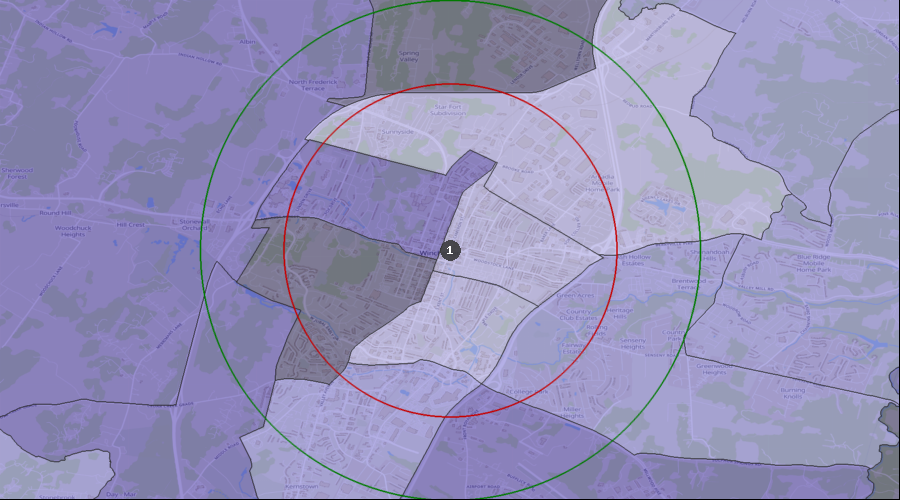
Visited a Dentist in Past 12 Months | 35.17% to 38.29% |
| 30.97% to 35.17% |
| 26.59% to 30.97% |
| 21.85% to 26.59% |
| 1. | Winchester |
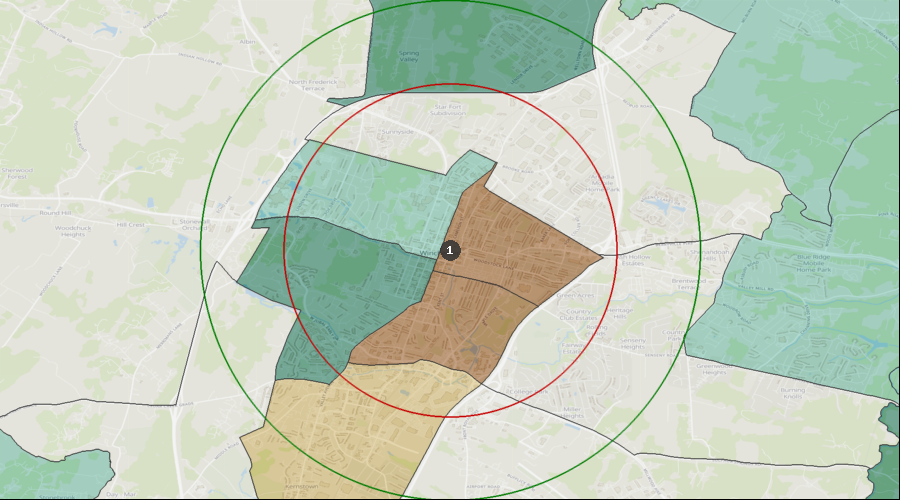
Percentage of the Population with a Bachelor's Degree
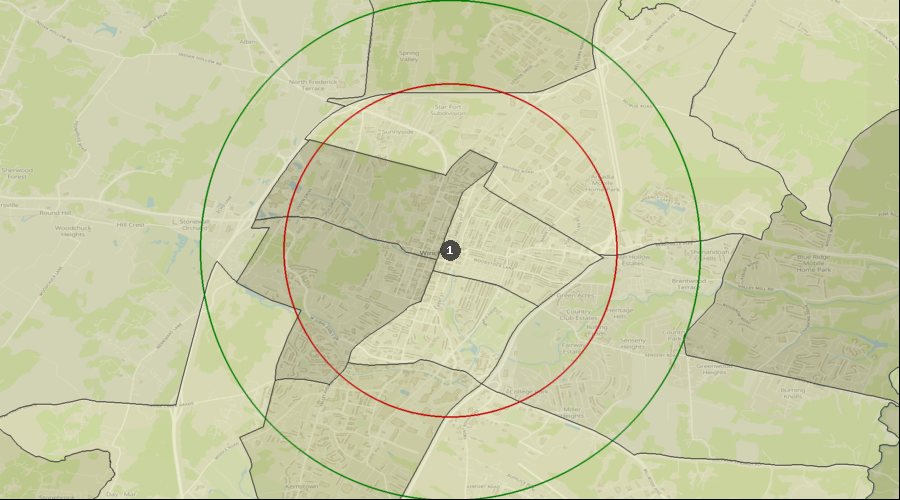
Education: Bach Deg by Census Tract | 40.39% to 59.83% |
| 33.89% to 40.39% |
| 24.81% to 33.89% |
| 14.48% to 24.81% |
| 1. | Winchester |
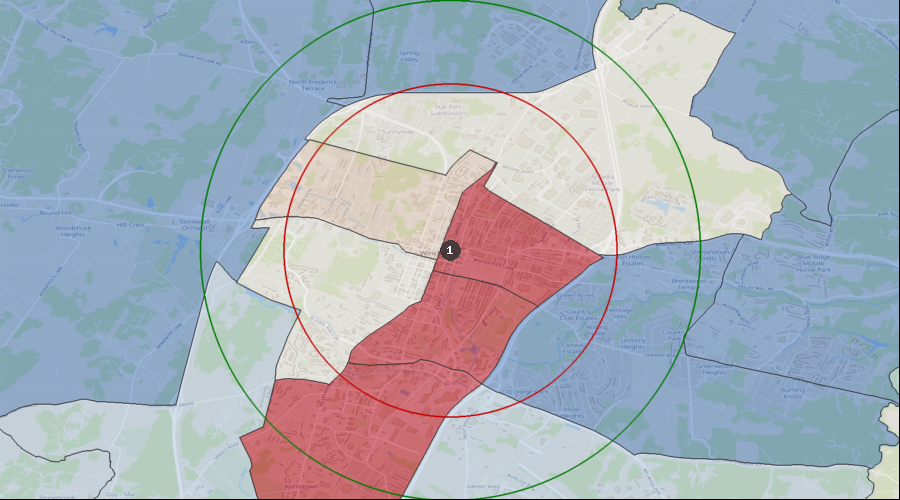
Lifestyle Behaviors – Household Entertainment/Recreation Average Expenditure
Ent/Recreation Per HH (Avg by Census Tract) | $4,180 to $4,794 |
| $3,367 to $4,180 |
| $2,746 to $3,367 |
| $2,136 to $2,746 |
| $1,875 to $2,136 |
| 1. | Winchester |
Projected Population Growth Rate
Projected Population Growth Per Year | 1.41% to 8.30% |
| 0.87% to 1.41% |
| 0.43% to 0.87% |
| -0.06% to 0.43% |
| -0.31% to -0.06% |
| 1. | Winchester |
Average Household Expenditure for Health Insurance
Health Insurance Avg/HH by Census Tract | $5,009 to $5,722 |
| $4,221 to $5,009 |
| $3,421 to $4,221 |
| $2,540 to $3,421 |
| $2,249 to $2,540 |
| 1. | Winchester |
Home Ownership Rates
Owner Occupied Households by Census Tract | 70.70% to 86.33% |
| 62.51% to 70.70% |
| 49.60% to 62.51% |
| 33.07% to 49.60% |
| 28.67% to 33.07% |
| 1. | Winchester |
Median Household Income
Median Household Income by Census Tract | $78k to $100k |
| $64k to $78k |
| $55k to $64k |
| $37k to $55k |
| 1. | Winchester |
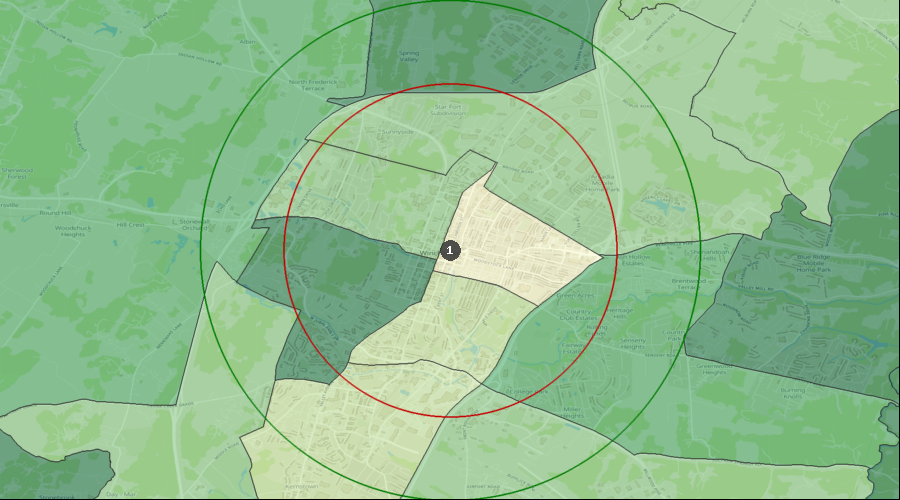
Daily Average Traffic Count
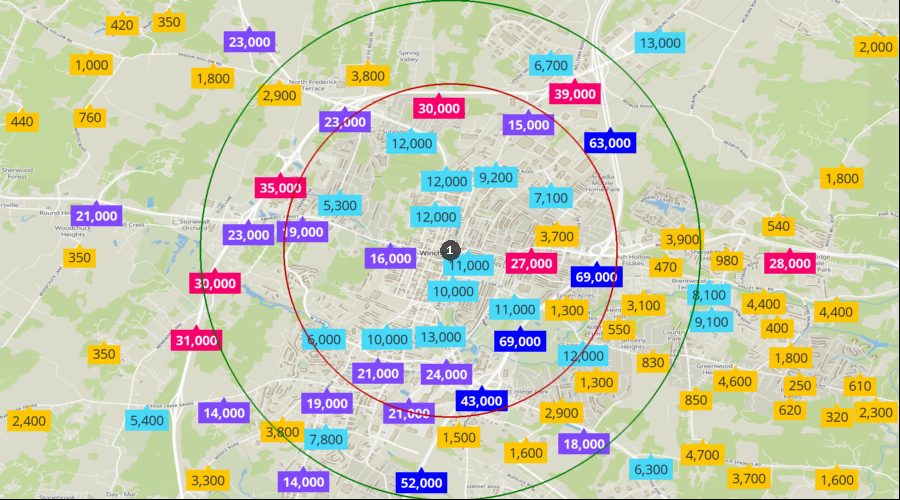
Traffic Counts | 43k to 69k |
| 26k to 43k |
| 14k to 26k |
| 5k to 14k |
| 0k to 5k |
| 1. | Winchester |