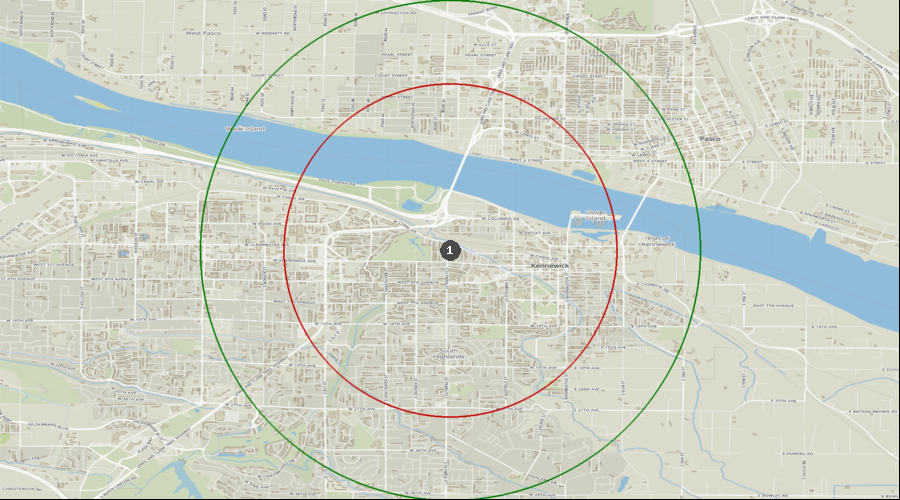
Kennewick, Washington - Dental Demographics Maps
Want comprehensive data on dentist to population ratios?
A Denali Demographic Study looks at the information in demographic reports like historical data, market saturation, growth drivers, and dental specific statistics, and interprets all these dental demographics to provide a viability ranking that other demographic reports typically don’t provide.
Get a custom study for as little as $159
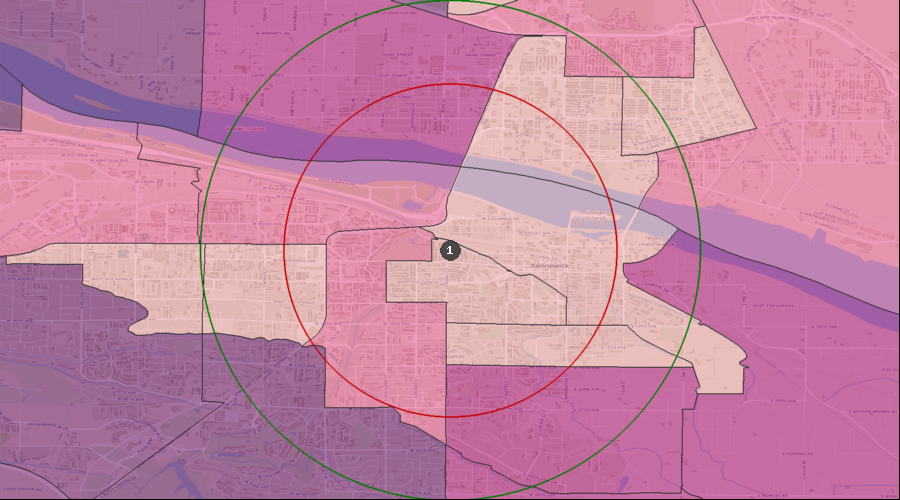
Average Dental Expenditures
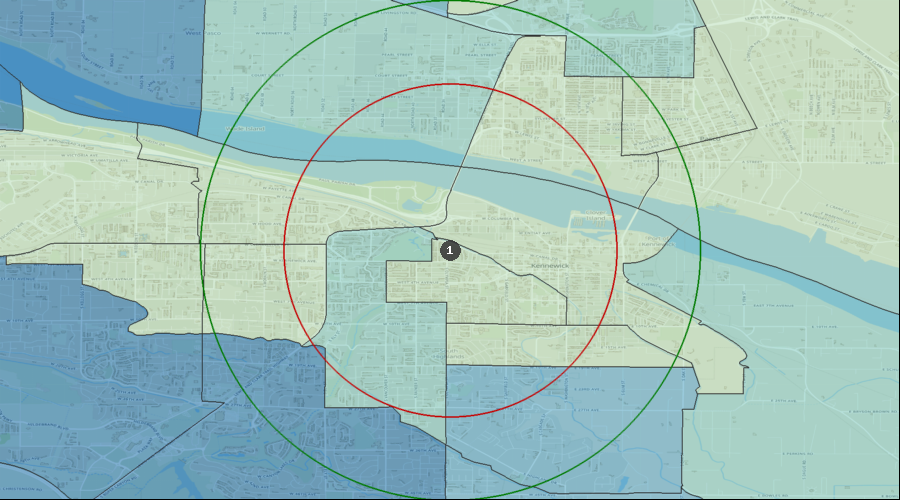
Dental Services per HH (Avg by Census Tract) | $450 to $647 |
| $366 to $450 |
| $275 to $366 |
| $0 to $275 |
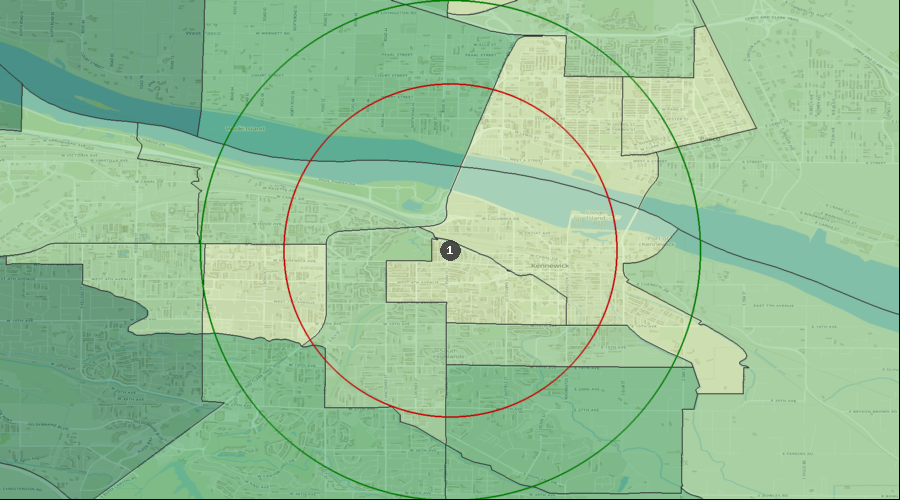
| 1. | Kennewick |
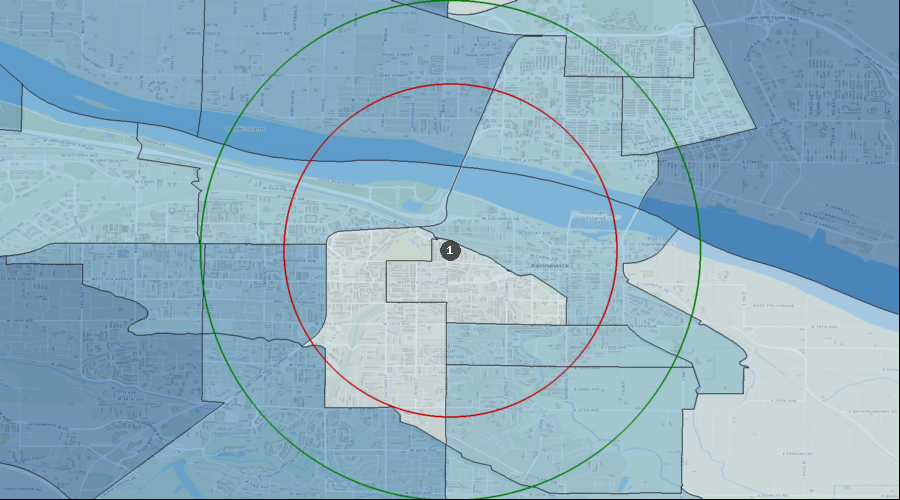
Percentage of the Population Visiting a Dentist in the Last 12 Months
Visited a Dentist in Past 12 Months | 29.63% to 35.71% |
| 24.91% to 29.63% |
| 18.87% to 24.91% |
| 0.00% to 18.87% |
| 1. | Kennewick |
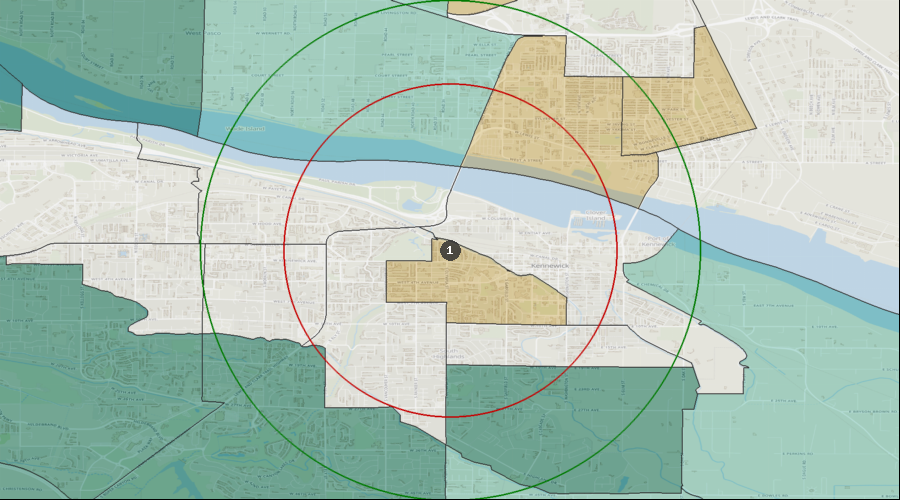
Percentage of the Population with a Bachelor's Degree
Education: Bach Deg by Census Tract | 28.60% to 49.24% |
| 19.98% to 28.60% |
| 13.14% to 19.98% |
| 7.31% to 13.14% |
| 0.00% to 7.31% |
| 1. | Kennewick |
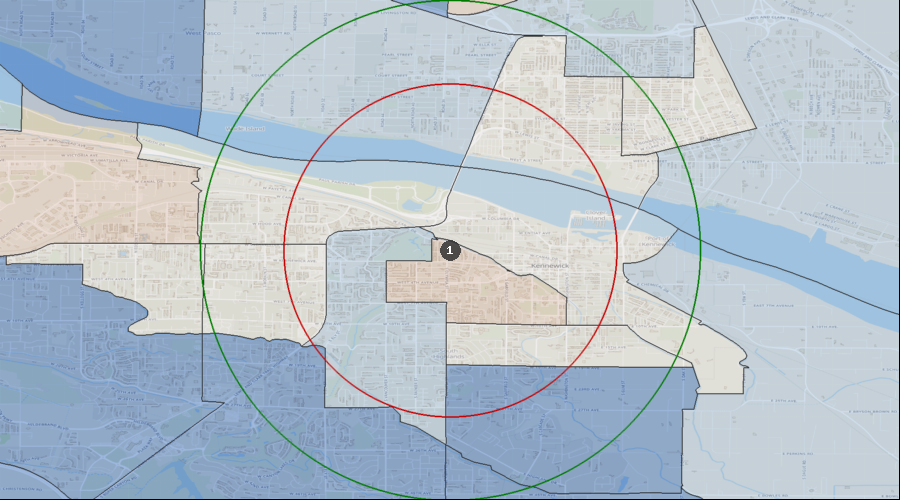
Lifestyle Behaviors – Household Entertainment/Recreation Average Expenditure
Ent/Recreation Per HH (Avg by Census Tract) | $3,775 to $5,368 |
| $2,900 to $3,775 |
| $2,095 to $2,900 |
| $0 to $2,095 |
| 1. | Kennewick |
Projected Population Growth Rate
Projected Population Growth Per Year | 2.04% to 3.28% |
| 1.27% to 2.04% |
| 0.94% to 1.27% |
| 0.00% to 0.94% |
| 1. | Kennewick |
Average Household Expenditure for Health Insurance
Health Insurance Avg/HH by Census Tract | $4,650 to $6,193 |
| $3,092 to $4,650 |
| $2,119 to $3,092 |
| $0 to $2,119 |
| 1. | Kennewick |
Home Ownership Rates
Owner Occupied Households by Census Tract | 76.00% to 93.89% |
| 53.02% to 76.00% |
| 34.24% to 53.02% |
| 0.00% to 34.24% |
| 1. | Kennewick |
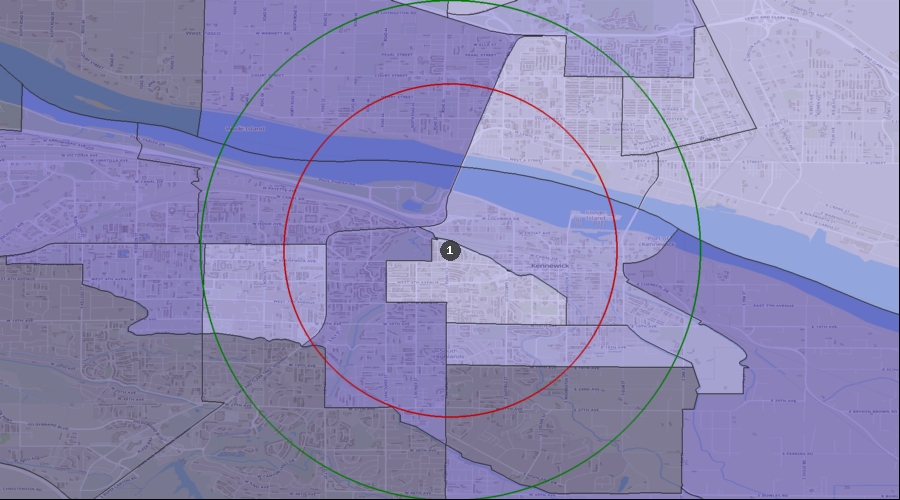
Median Household Income
Median Household Income by Census Tract | $90k to $116k |
| $65k to $90k |
| $41k to $65k |
| $0k to $41k |
| 1. | Kennewick |
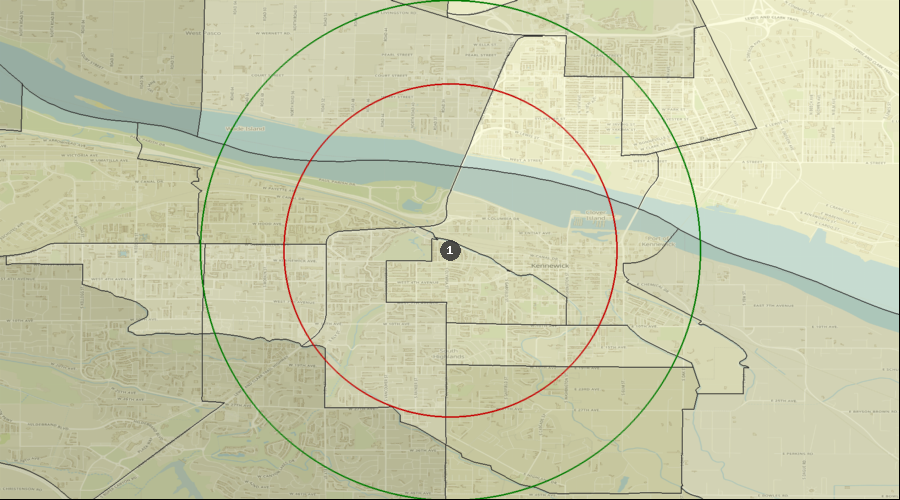
Daily Average Traffic Count
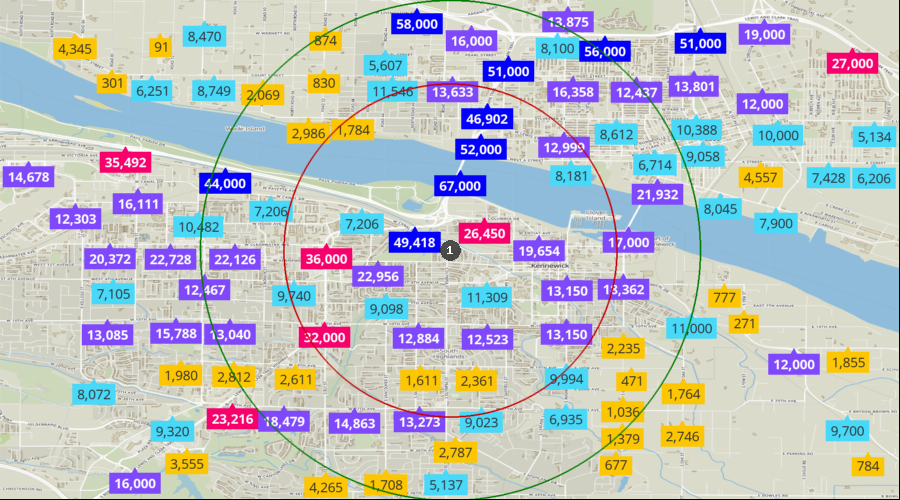
Traffic Counts | 38k to 67k |
| 23k to 38k |
| 12k to 23k |
| 5k to 12k |
| 0k to 5k |
| 1. | Kennewick |