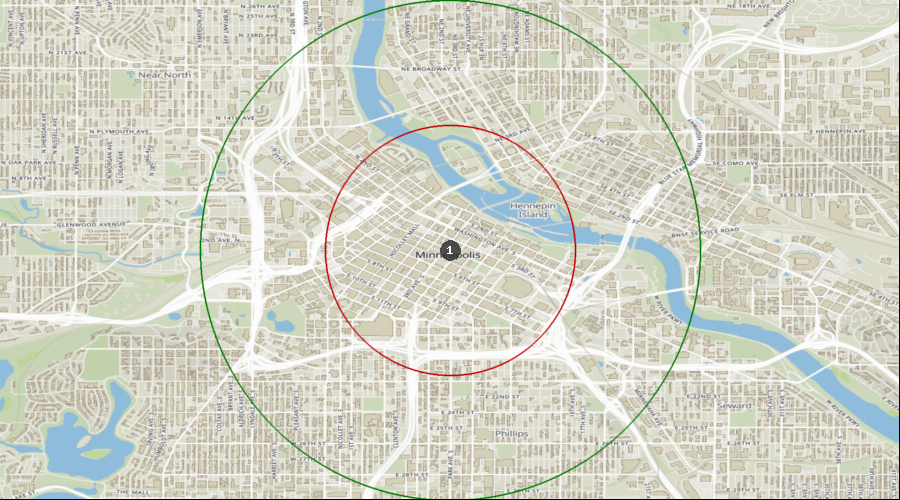
Minneapolis, Minnesota - Dental Demographics Maps
Want comprehensive data on dentist to population ratios?
A Denali Demographic Study looks at the information in demographic reports like historical data, market saturation, growth drivers, and dental specific statistics, and interprets all these dental demographics to provide a viability ranking that other demographic reports typically don’t provide.
Get a custom study for as little as $159
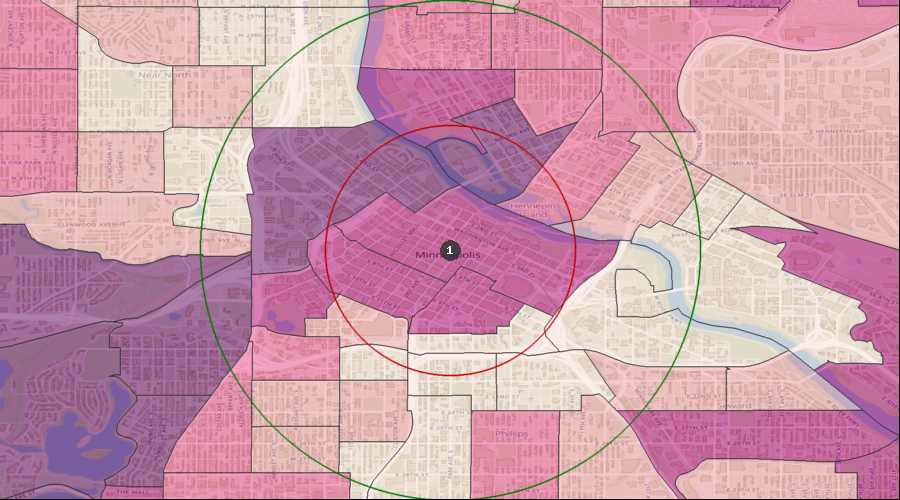
Average Dental Expenditures
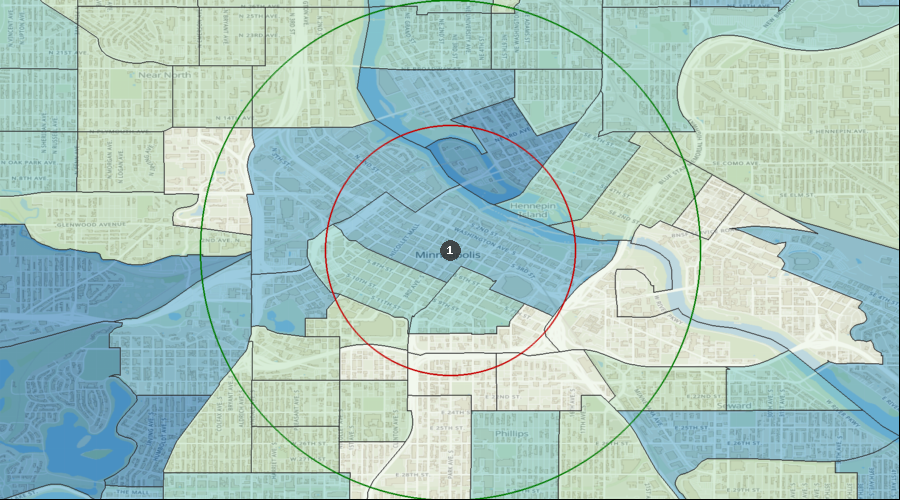
Dental Services per HH (Avg by Census Tract) | $519 to $766 |
| $362 to $519 |
| $256 to $362 |
| $179 to $256 |
| $105 to $179 |
| 1. | Minneapolis |
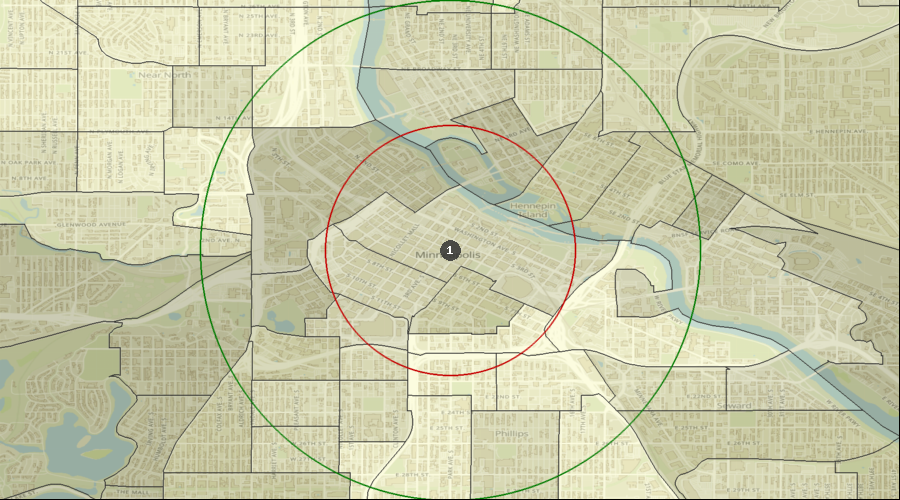
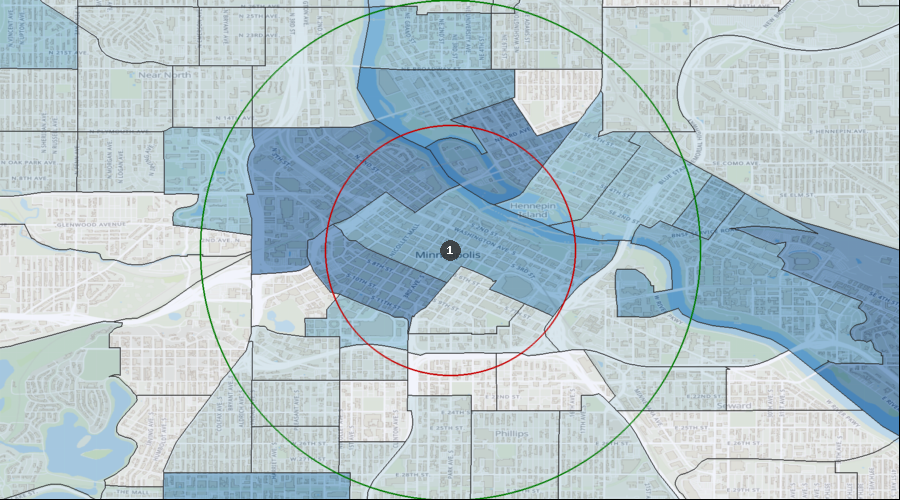
Percentage of the Population Visiting a Dentist in the Last 12 Months
Visited a Dentist in Past 12 Months | 35.60% to 42.54% |
| 29.95% to 35.60% |
| 23.58% to 29.95% |
| 20.50% to 23.58% |
| 17.92% to 20.50% |
| 1. | Minneapolis |
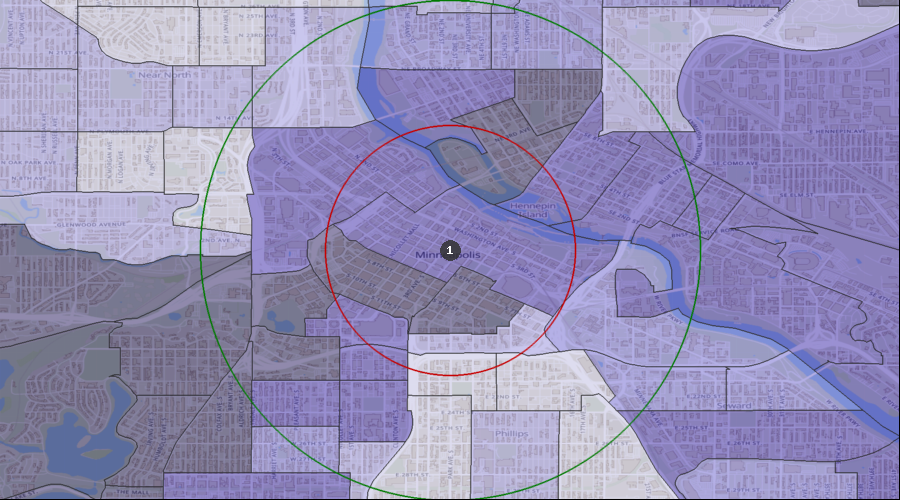
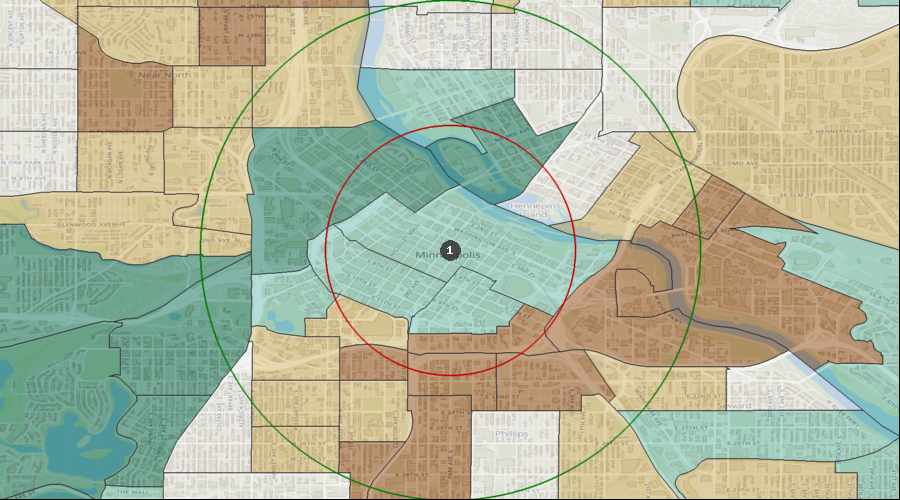
Percentage of the Population with a Bachelor's Degree
Education: Bach Deg by Census Tract | 68.26% to 85.51% |
| 58.19% to 68.26% |
| 46.66% to 58.19% |
| 29.17% to 46.66% |
| 8.91% to 29.17% |
| 1. | Minneapolis |
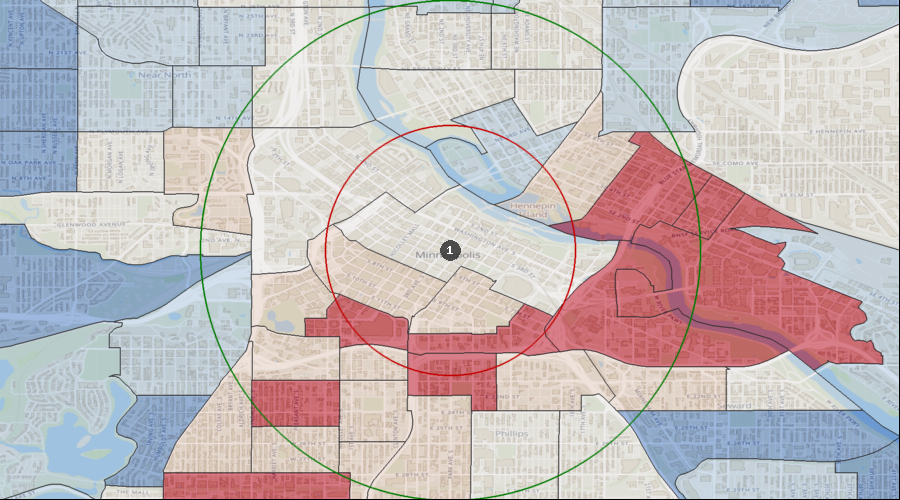
Lifestyle Behaviors – Household Entertainment/Recreation Average Expenditure
Ent/Recreation Per HH (Avg by Census Tract) | $4,347 to $7,118 |
| $3,209 to $4,347 |
| $2,428 to $3,209 |
| $1,730 to $2,428 |
| $1,123 to $1,730 |
| 1. | Minneapolis |
Projected Population Growth Rate
Projected Population Growth Per Year | 3.29% to 4.94% |
| 2.17% to 3.29% |
| 1.45% to 2.17% |
| 0.65% to 1.45% |
| -0.11% to 0.65% |
| 1. | Minneapolis |
Average Household Expenditure for Health Insurance
Health Insurance Avg/HH by Census Tract | $4,864 to $7,729 |
| $3,540 to $4,864 |
| $2,796 to $3,540 |
| $1,943 to $2,796 |
| $1,292 to $1,943 |
| 1. | Minneapolis |
Home Ownership Rates
Owner Occupied Households by Census Tract | 46.37% to 81.87% |
| 33.80% to 46.37% |
| 21.10% to 33.80% |
| 9.95% to 21.10% |
| 1.86% to 9.95% |
| 1. | Minneapolis |
Median Household Income
Median Household Income by Census Tract | $87k to $126k |
| $67k to $87k |
| $45k to $67k |
| $30k to $45k |
| $15k to $30k |
| 1. | Minneapolis |
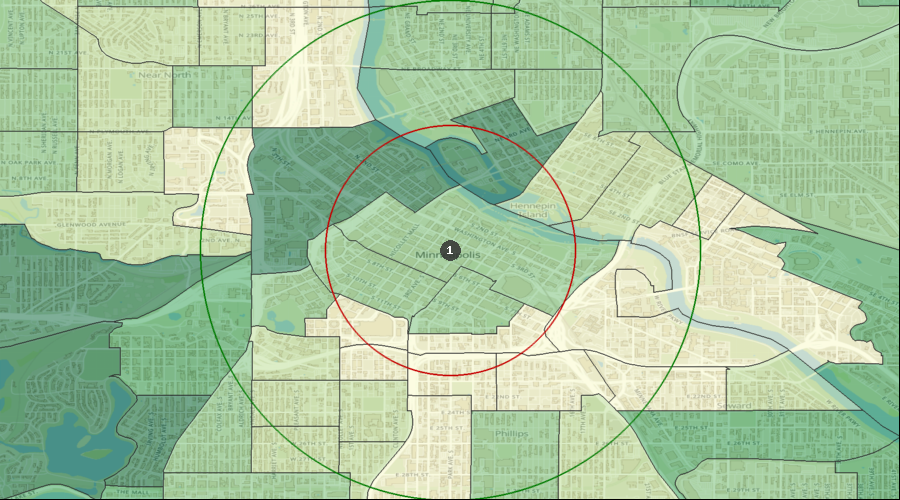
Daily Average Traffic Count
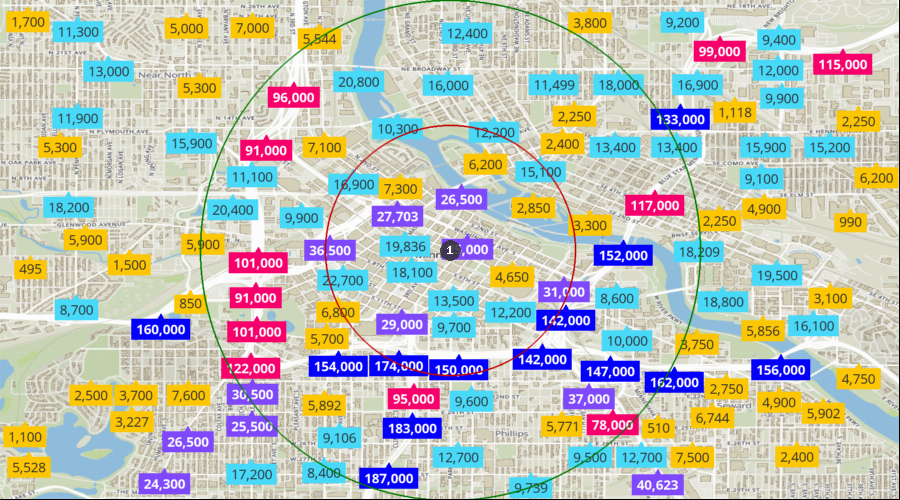
Traffic Counts | 128k to 187k |
| 69k to 128k |
| 24k to 69k |
| 8k to 24k |
| 0k to 8k |
| 1. | Minneapolis |