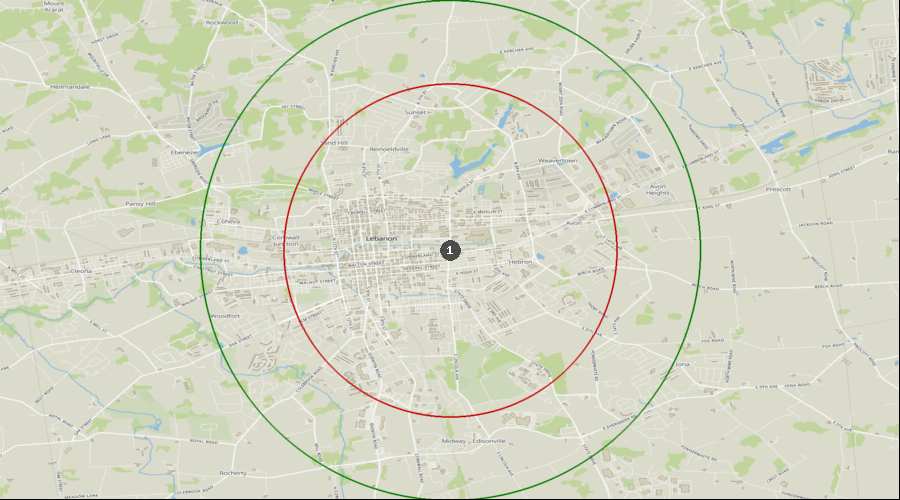
Lebanon, Pennsylvania - Dental Demographics Maps
Want comprehensive data on dentist to population ratios?
A Denali Demographic Study looks at the information in demographic reports like historical data, market saturation, growth drivers, and dental specific statistics, and interprets all these dental demographics to provide a viability ranking that other demographic reports typically don’t provide.
Get a custom study for as little as $159
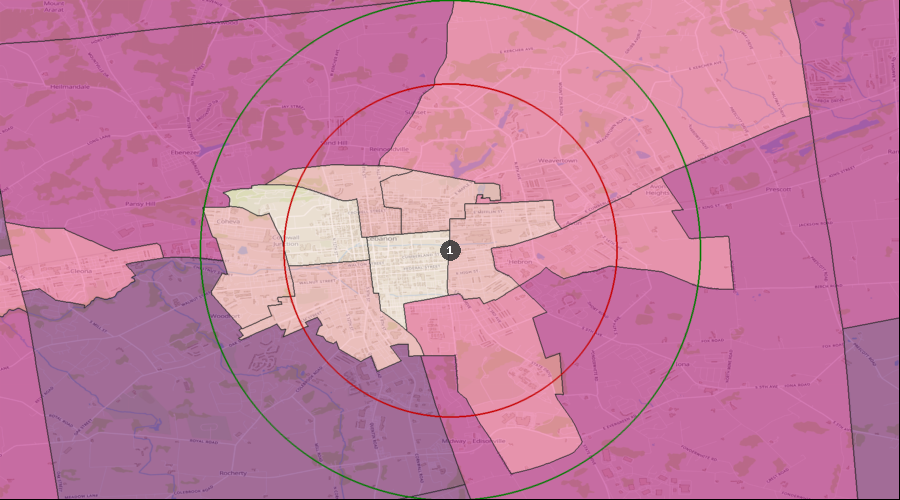
Average Dental Expenditures
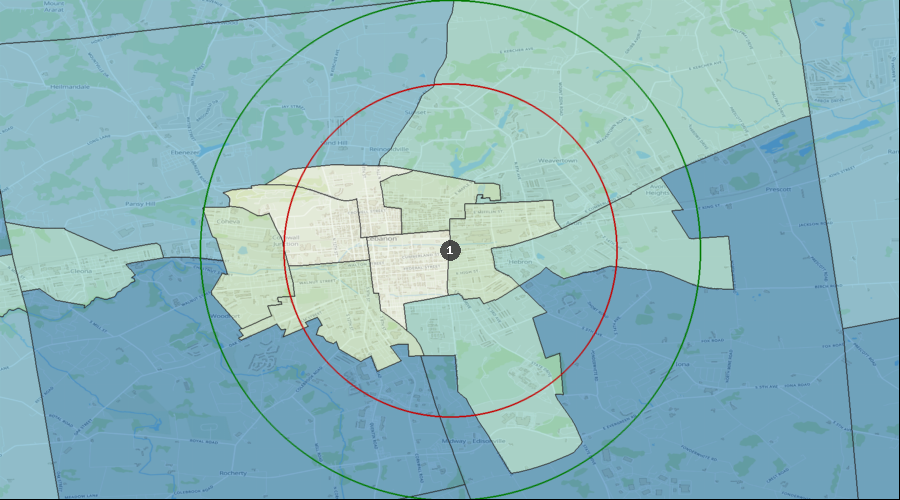
Dental Services per HH (Avg by Census Tract) | $400 to $465 |
| $334 to $400 |
| $258 to $334 |
| $185 to $258 |
| $173 to $185 |
| 1. | Lebanon |
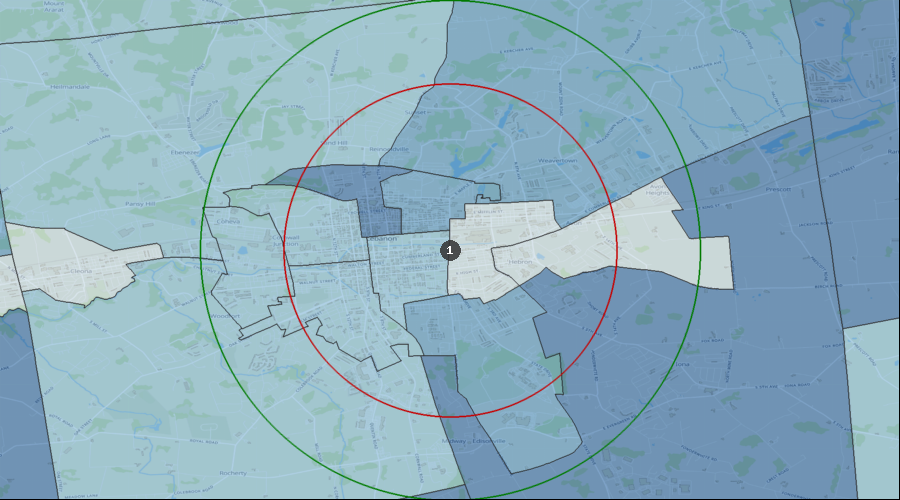
Percentage of the Population Visiting a Dentist in the Last 12 Months
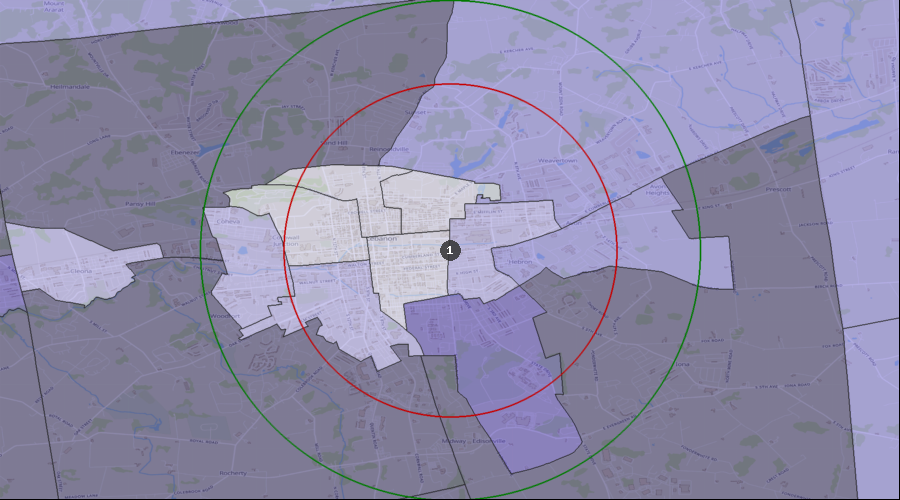
Visited a Dentist in Past 12 Months | 33.58% to 40.42% |
| 29.99% to 33.58% |
| 26.16% to 29.99% |
| 20.63% to 26.16% |
| 19.57% to 20.63% |
| 1. | Lebanon |
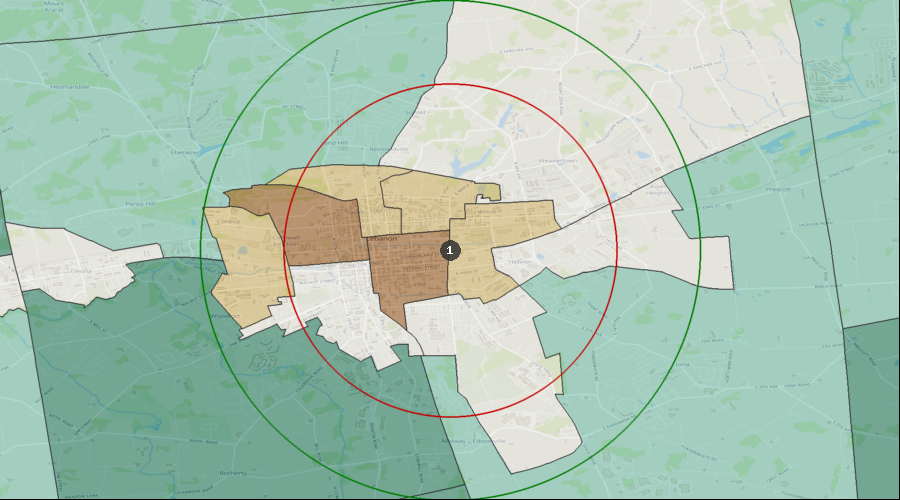
Percentage of the Population with a Bachelor's Degree
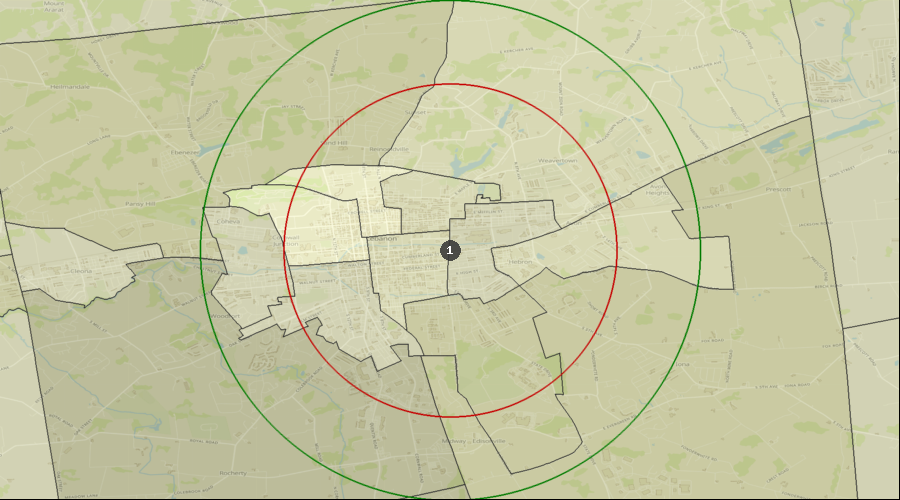
Education: Bach Deg by Census Tract | 30.23% to 39.89% |
| 23.13% to 30.23% |
| 14.19% to 23.13% |
| 3.70% to 14.19% |
| 3.41% to 3.70% |
| 1. | Lebanon |
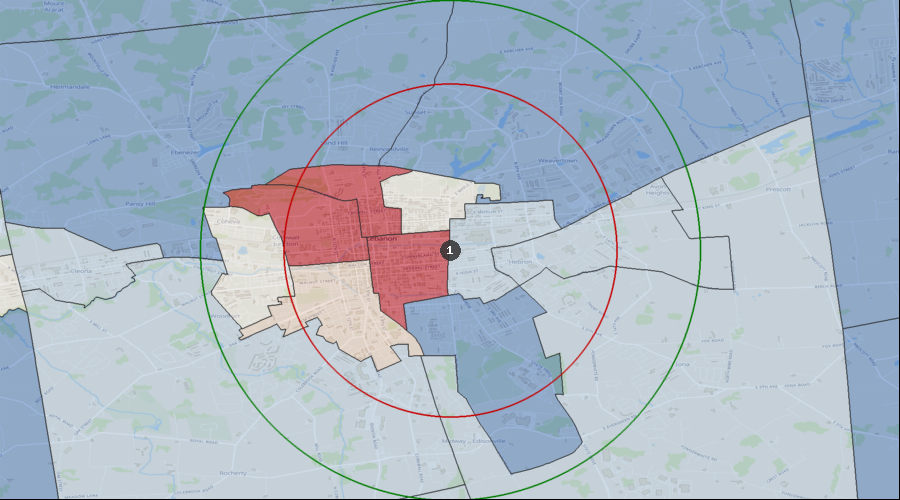
Lifestyle Behaviors – Household Entertainment/Recreation Average Expenditure
Ent/Recreation Per HH (Avg by Census Tract) | $3,414 to $3,915 |
| $2,826 to $3,414 |
| $2,216 to $2,826 |
| $1,654 to $2,216 |
| $1,497 to $1,654 |
| 1. | Lebanon |
Projected Population Growth Rate
Projected Population Growth Per Year | 0.97% to 1.51% |
| 0.61% to 0.97% |
| 0.36% to 0.61% |
| 0.02% to 0.36% |
| 1. | Lebanon |
Average Household Expenditure for Health Insurance
Health Insurance Avg/HH by Census Tract | $4,229 to $4,771 |
| $3,561 to $4,229 |
| $2,779 to $3,561 |
| $2,089 to $2,779 |
| $1,886 to $2,089 |
| 1. | Lebanon |
Home Ownership Rates
Owner Occupied Households by Census Tract | 72.83% to 83.21% |
| 55.67% to 72.83% |
| 40.81% to 55.67% |
| 31.21% to 40.81% |
| 26.37% to 31.21% |
| 1. | Lebanon |
Median Household Income
Median Household Income by Census Tract | $71k to $82k |
| $62k to $71k |
| $44k to $62k |
| $31k to $44k |
| $29k to $31k |
| 1. | Lebanon |
Daily Average Traffic Count
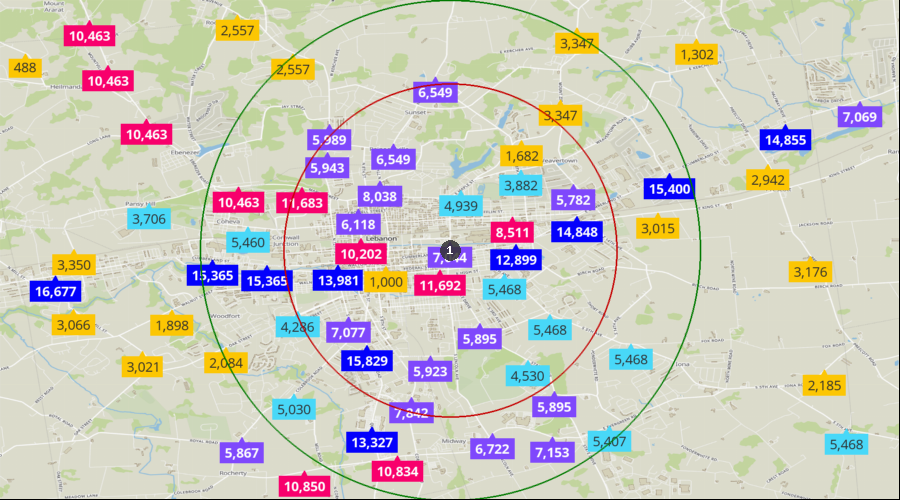
Traffic Counts | 11,944 to 16,677 |
| 8,511 to 11,944 |
| 5,473 to 8,511 |
| 3,492 to 5,473 |
| 488 to 3,492 |
| 1. | Lebanon |