Lebanon, Pennsylvania - Dental Demographics - Traffic
Want comprehensive data on dentist to population ratios?
A Denali Demographic Study looks at the information in demographic reports like historical data, market saturation, growth drivers, and dental specific statistics, and interprets all these dental demographics to provide a viability ranking that other demographic reports typically don’t provide.
Get a custom study for as little as $159
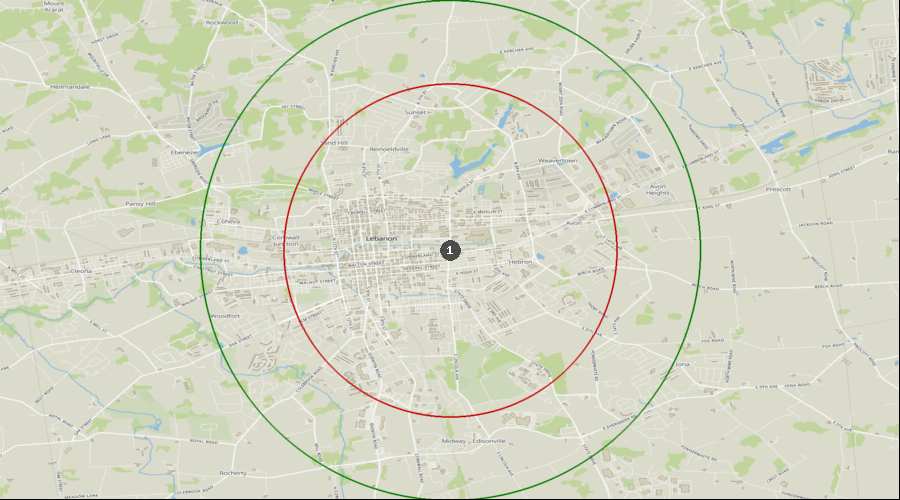
Daily Average Traffic Count
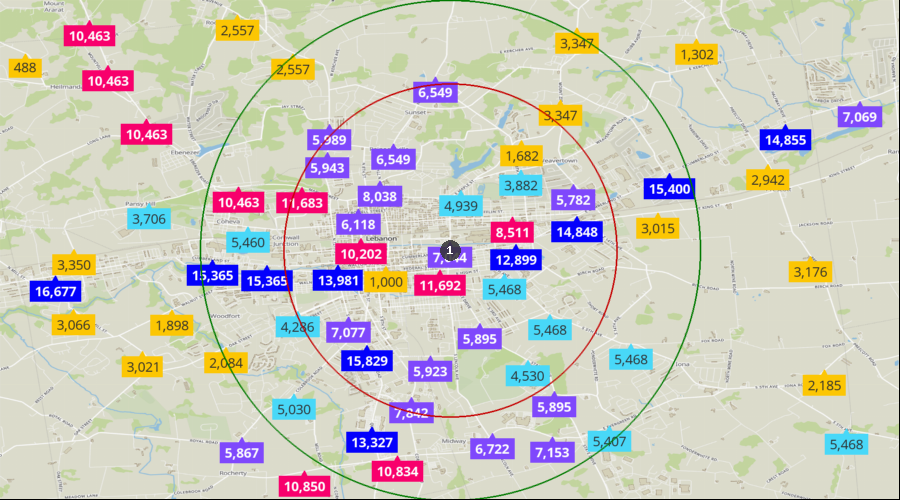
Traffic Counts | 11,944 to 16,677 |
| 8,511 to 11,944 |
| 5,473 to 8,511 |
| 3,492 to 5,473 |
| 488 to 3,492 |
| 1. | Lebanon |